Some refer to ENSO as a cycle as it has two phases called El Nino and La Nina and a transition phase called ENSO Neutral. It is often referred to as a cycle but it is not as regular as a cycle like one finds with electric current. The amplitude of its phases varies and there can be repetitions of the same phase. Some call this an oscillation. I am using the term quasi-cycle. Most weather cycles have the characteristic of not being as regular as some phenomena we see in science such as astronomical cycles. These cycles are also not totally regular but regular enough that we can create calendars and predict the phases of such cycles.
On the second Thursday of every month, NOAA (really their Climate Prediction Center CPC) issues its analysis of the status of ENSO. This includes determining the Alert System Status. I will cover this in Part I of this article. In Part II I will add additional information to the Alert System Status Report issued on April 10, 2025 and in Part III I will discuss some reasons for thinking the ENSO pattern is changing and why this is very important.
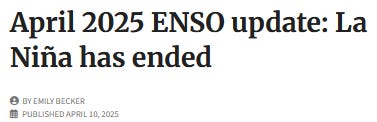
NOAA now describes their conclusion as "ENSO Alert System Status: "Final La Niña Advisory”. La Nina is over but some of the impacts may tend to linger during the transition.
"Synopsis: ENSO-neutral is favored during the Northern Hemisphere summer, with a greater than 50% chance through August-October 2025.”
Of course, we are interested in next winter. We are still dealing with what is called the Spring Prediction Barrier so predictions that far out right now have historically not had a high level of accuracy.
* The current status is ENSO Neutral but the “Alert” issued was that this was their final Advisory on La Nina. It is confusing.
We have included excerpts from a very interesting ENSO Blog Post by Emily Becker.
I am going to quote from her current article as it provides a clue to the issue of a possible change in the ENSO pattern.
In addition, the historical ENSO table uses a centered averaging period, e.g., the individual years in 1986–1990 are compared to the 30-year average 1971–2000, and the years in 1991–1995 are compared to 1976–2005. Check out CPC’s webpage on the “rolling” climatology approach.
The reason for mentioning this detail is that this past winter does not qualify as a La Niña event in our historical table, because it did not last 5 consecutive rolling seasons (we call any 3-month-average a season) exceeding the -0.5 °C threshold. However, in 2036, this past winter will be near the middle of a 30-year period (2006–2035), which is very likely to be warmer than the 1991–2020 average. Thus, with the benefit of another decade, this year’s small La Niña may be cooler when compared to that warmer averaging period. So, in 2036, the 2024–25 winter may end up colored blue, and be considered a formal La Niña, in the historical table.
This complexity is one of the reasons we have been mentioning relative sea surface temperature anomalies, which are the sea surface temperature differences from average in a particular location, like the Niño-3.4 region, relative to the entire tropical average sea surface temperature. By using relative sea surface temperature measures, we can skip calculating all of these rolling climatologies. For the relative index, we only need to use a single climatology over the entire historical record. As we have mentioned in recent blog posts (here and here and here), the relative Niño-3.4 index has also been better than the more traditional indexes at describing the intensity of the expected atmospheric response to ENSO during this past La Niña.
So one wonders if the inability of the current approach to identify and quantify a La Nina is within the range of statistical confidence intervals or has the behavior of the ENSO Climate Cycle changed. There are many ways to look at this issue and I will discuss some of them in Part III of this article.
The IRI and North American multi-model ensemble indicate ENSO-neutral will continue through the summer. The forecast team also favors ENSO-neutral, with chances well over 50% through summer 2025. Because of reduced forecast accuracy in the spring, the uncertainty increases at longer time horizons, with a 43% chance of ENSO-neutral and a 38% chance of La Niña during November 2025 - January 2026 (chances of El Niño are under 20%). In summary, ENSO-neutral is favored during the Northern Hemisphere summer, with a greater than 50% chance through August-October 2025.
Below is the middle paragraph from the discussion last month.
The IRI and North American multi-model ensemble predicts a transition to ENSO-neutral in the coming season. The forecast team concurs and predicts ENSO-neutral, with chances greater than 50% through July-September 2025. As is typical for forecasts made in the spring, there is large forecast uncertainty at longer time horizons, with no outcome exceeding a 50% chance (chances of El Niño are the lowest). In summary, ENSO-neutral is favored to develop in the next month and persist through the Northern Hemisphere summer (62% chance in June-August 2025.
Part II. We now provide additional details.
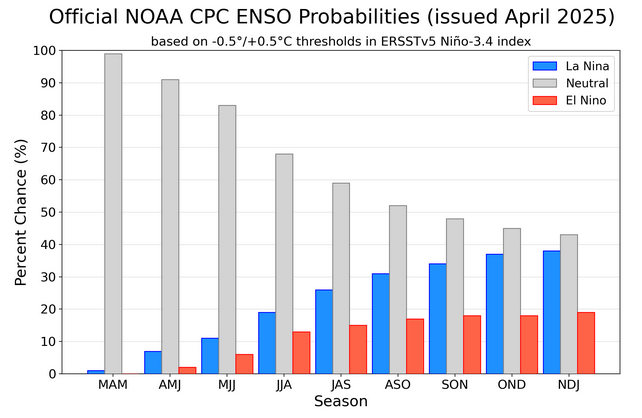
CPC Probability Distribution
Here are the new forecast probabilities. The probabilities are for three-month periods e.g. MAM stands for March/April/May.
Here is the forecast from last month.
So it looks like NOAA (CPC) is more confident that ENSO Neutral will continue through ASO 2025.
Looking at Actual Current Conditions.
NOAA reports some derived data that describes the current situation and a forecast. But what if we want to form our own opinion? After all, meteorologists are looking at the actual current situation and making predictions.
This shows the current situation for the surface of oceans. To update this graphic click HERE.
You can see some cool water along the Equator but it is mostly west of 170W Latitude and spotty. Thus the NINO 3.4 Measurement Area is clearly ENSO Neutral. That does not mean that it can not still produce La Nina-like weather.
Putting the historical information in motion. Updates can be found HERE. but should not be needed.
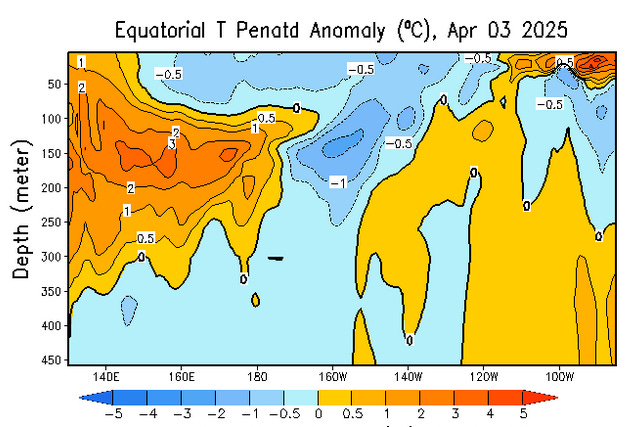
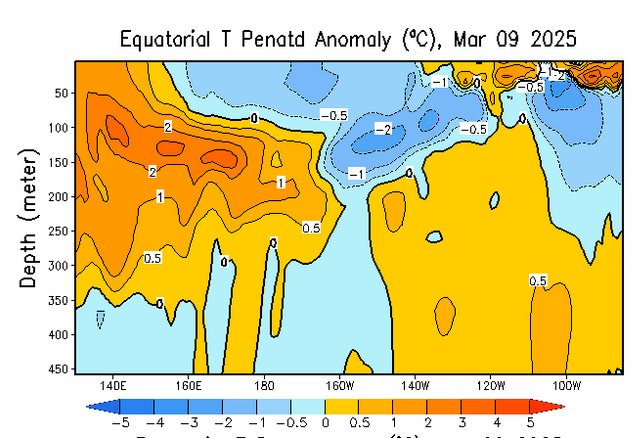
Now we look at the distribution of the temperature anomalies from the surface down to 450 meters.
And last month
Not much change.
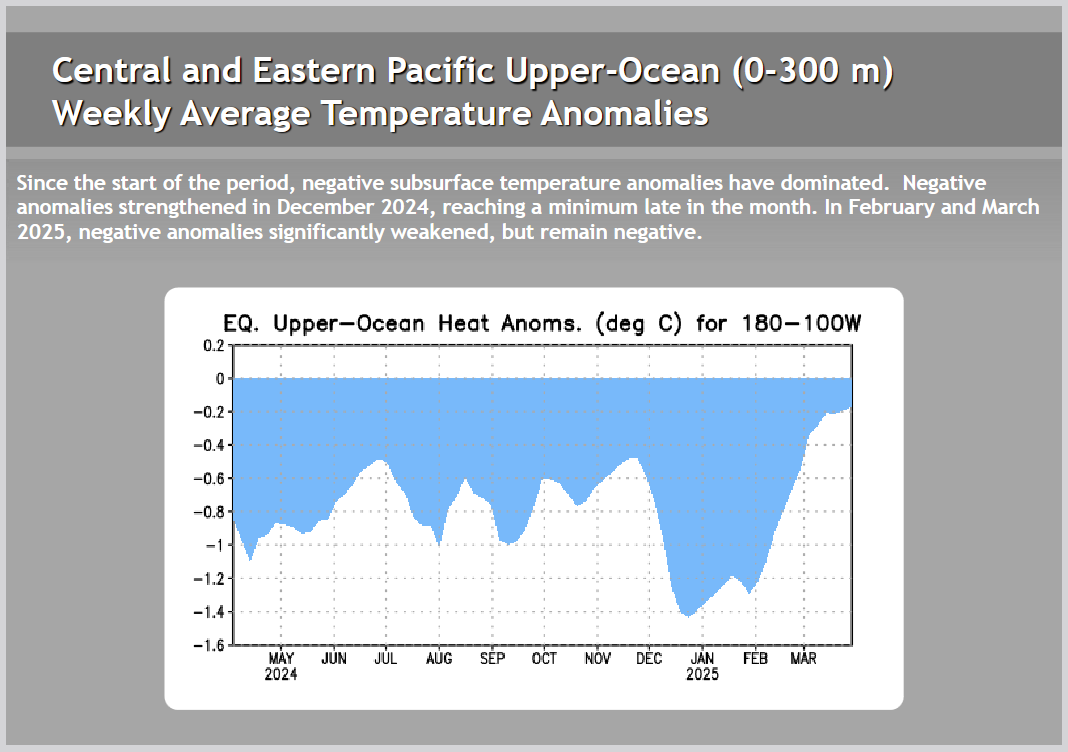
Now we look at the time trend of the sum of the below surface temperature anomalies along the Equator. The data is a five-day average centered on the date shown. It no longer looks robust. What counts is the surface since only the surface interacts with the atmosphere.
The cool anomaly has declined dramatically but what counts is the surface.
This shows the water column anomaly is less negative. This and other graphics suggest that the La Nina is really gone.
Kelvin Waves
The Indo-Pacific Warm Pool is gradually expanding to the east. To me, this indicates the probable end of the La Nina plus the possibility of El Nino this coming winter. But the process where a La Nina skims warm water from the surface driving it west to the Indo-Pacific Warm Pool was not strong enough to cause a near-term rebound to El Nino. I will monitor this every month.
Normally I would want to take a look at the SOI Index but I did not conclude that it was necessary this month. For those with curiosity, HERE is the link to the U.S. version. HERE is the link to the Australia Bureau of Meteorology (BOM) version of that graph.
Assessment of the Australian Bureau of Meteorology (BOM) LINK.
The Australian Bureau of Meteorology never declared a La Nina but their criteria are a bit stricter than those used by the U.S.. Overall, their readings of NINO 3.4 are the same as the U.S.. but they have stricter criteria for declaring a La Nina presumably because a very weak La Nina has little impact on Australia. They now show that NINO 3.4 is showing ENSO Neutral.
Normally I would now present excerpts from the recent ENSO Blog Post by Emily Becker. (You can read her full article HERE).
I provided some text from her article in Part I. Here I will just show one graphic.
Line graph showing observed and predicted temperatures (black line) in the key ENSO-monitoring region of the tropical Pacific from spring 2025 through the fall. The gray shading shows the range of temperatures predicted by individual models that are part of the North American Multi Model Ensemble (NMME, for short). By late summer, the shading spans from El Niño to La Niña, showing the range of potential ENSO states. However, the majority of model forecasts are concentrated in the neutral range, meaning the highest chance is that the temperature in the Niño-3.4 region of the tropical Pacific will be near average. NOAA Climate.gov image, based on data provided by Climate Prediction Center.
There is a wide spread in this forecast. The mean of the forecasts shows a slight La Nina bias meaning it is slightly less than zero.
Forecasts made in the spring are known to be less successful than forecasts made in the rest of the year, an effect called the “spring predictability barrier.” We don’t have a clear understanding of why forecasts are worse this time of year, but one potential culprit is that ENSO tends to be changing phase (e.g., going from La Niña to neutral). For lots more detail on the spring predictability barrier, check out this post and this one on Seasoned Chaos on the topic.
As spring turns to summer, our crystal ball should become clearer. For now, we’ll bid La Niña adieu and bide our time in neutral.
Part III: The Possibility that ENSO is changing to some extent.
Here we are going to look at three ENSO Blog Posts.
But first let us take a look at this graphic.
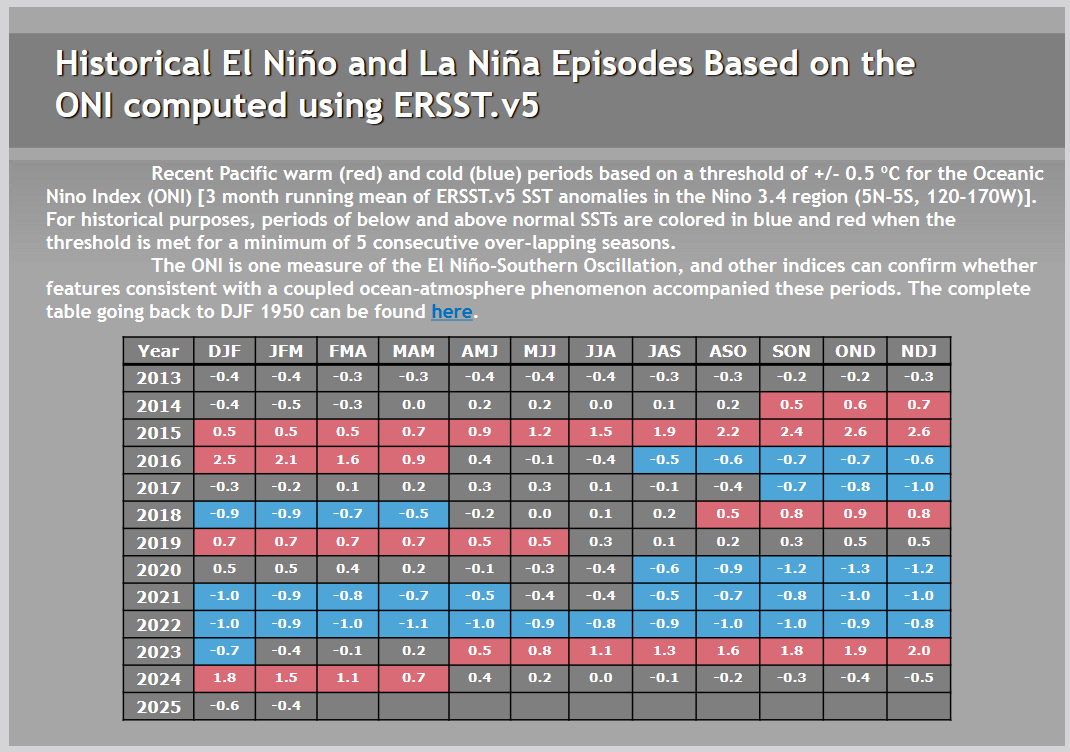
The ONI is the running three-month average of the Nino 3.4 values.
What it shows is this current La Nina does not record as a La Nina.
One could argue that DJF did but to be a La Nina you need five consecutive ONI values of -0.5 or less. But we know that we had impacts of a fairly strong La Nina.
First I want to clarify how ENSO phases are defined. The primary criterion is the ocean temperature anomaly compared to climatology. This needs to be supported by the atmosphere responding to that surface temperature Anomaly.
The schematic above shows the Equatorial Pacific and three areas designated as Nino 1 + 2, Nino 3 and Nino 4. Years ago it was concluded that another area that encompassed part of Nino 3 and Part of Nino 4 was the best place to monitor ENSO and this was called Nino 3.4 I do not know how this area was determined but I assume it was by correlation with historical ENSO events.
The criterion for the temperature anomaly is that 0C to plus or minus 0.5C is ENSO Neutral and El Nino is when the surface water anomaly in Nino 3.4 is 0.5C or warmer and La Nina is 0.5C or colder.
In THIS May 4, 2021 post by Michelle L'Heureux questions were raised about the scale used to determine ENSO phases when ocean temperatures worldwide were rising. This graphic was presented in the Michelle L’Heureux post.
I do not see differential warming in the tropics other than an area of cooling. An El Nino was happening at that time so the thought was to subtract the differential warming overall in the tropics from the differential warming in the NINO 3.4 Area to get a “Relative” Nino 3.4 Reading. They concluded that this was helpful.
Not discussed in that paper is a trend to have ENSO events that happen further west than the Nino 3.4 Measurement area. The Japanese call such events Modokis.
Since then we have had a very weak La Nina which had the impacts normally associated with stronger La Nina events and the thought was to do the same calculation to derive a relative Nino 3.4 Index. This is described HERE and HERE and the key graphic is:
I am not sure that the wording in the graphic is correct but the graph suggests that with the relative Nino 3.4 correction the recent La Nina seems to be more in line with the actual impacts and more in line with historical La Ninas in terms of the calculated values of the Nino 3.4 Index.
So far this is experimental and not officially used but it is considered as NOAA develops its monthly outlook updates.
What does this mean for the future?
That is a difficult question to answer for many reasons including the limited amount of data that we have and the fact that we do not really fully understand the ENSO Cycle. But here are some of the possibilities:
A. The Nino 3.4 Index method of measurement might be changed. This could involve one or both of adjusting the method of calculation and either changing the definition of the boundaries of 3.4 or including the index for Nino 4.0 in the calculation. I think this is highly likely to happen but it is not likely to happen right away and I doubt that the “Relative Nino 3.4 calculation they are currently toying with will be the final approach.
B. If the trend that I see for more westerly displaced ENSO events which the Japanese call Modokis continues, the impacts associated with Modokis will occur more often and the longer-term predictions of weather - outlooks may become more accurate.
C. The ratio of El Ninos to La Ninas might change but so far there is not enough evidence to draw any conclusions on this. Based on the current way of computing the Index, there are more strong El Ninos to Strong La Ninas but changing the way the index is calculated could change that and is likely to change that.
D. Perhaps the main question is will these events tend to be stronger? It is complex but La Ninas tend to be dry for the U.S. and wet almost everywhere else with the reverse for El Ninos. In general, a warmer Earth will make weather events more intense. It is not clear that this overall trend will apply to the ENSO Cycle. We know it applies to the index readings But if the measurement system is changed, the upward trend in the index values may no longer occur.
E. ENSO impacts tropical events. La Ninas are associated with strong Equatorial Easterlies. With El Nino, you have weaker Equatorial Easterlies. It is not clear what is cause and effect but either way, it impacts tropical storms. It is a somewhat different issue than the strength of tropical events which is toward stronger events.
I reserve the right to amend this section of the article via comments on my article as think about it over the coming week or so. Thus I encourage readers to revisit the article to see if I have submitted comments to this article. Readers are always invited to submit comments.
I hope you found this article interesting and useful.
The EconCurrents is primarily a reader-supported publication. To receive new posts and support our work, please consider becoming a free or paid subscriber.
This article focuses on what we are paying attention to in the next 48 to 72 hours. The article also includes weather maps for longer-term U.S. outlooks (up to four weeks) and three- and six-day World weather outlooks which can be very useful for travelers and understanding World News Events. We also provide continual coverage of world tropical events and special coverage for such events and other special weather situations impacting or likely to impact the United States. To get your local forecast plus active alerts and warnings click HERE and enter your city, state or zip code in the upper left corner.
Disclaimer
Nothing in this EconCurrents newsletter is financial, investment, legal, or any other type of professional advice. Anything provided in any newsletter is for informational purposes only and is not meant to be an endorsement of any type of activity or any particular market or product.


Sorry, but the landing Graphic should have said "ENSO Alert Status ENSO Neutral.
My mistake but it is clear in the text.