


NOAA Updates its Four-Season Outlook as We Transition into ENSO Neutral
Thus volatility can be expected since ENSO exerts little to any control but the Outlook for next Winter is not yet clear.

On the third Thursday of the month right on schedule NOAA issued their updated Seasonal Outlook which I describe as their Four-Season Outlook because it extends a bit more than one year into the future. The information released also included the Mid-Month Outlook for the following month plus the weather and drought outlook for the next three months. I present the information issued by NOAA and try to add context to it. It is quite a challenge for NOAA to address the subsequent month, the subsequent three-month period as well as the twelve successive three-month periods for a year or a bit more.
We are now classified as experiencing ENSO Neutral conditions. But some impacts from the weak and not officially declared (too short) La Nina my linger at least into May.
Let's Take a Look at the (mid-month) Outlook for May.
It will be updated on the last day of April.
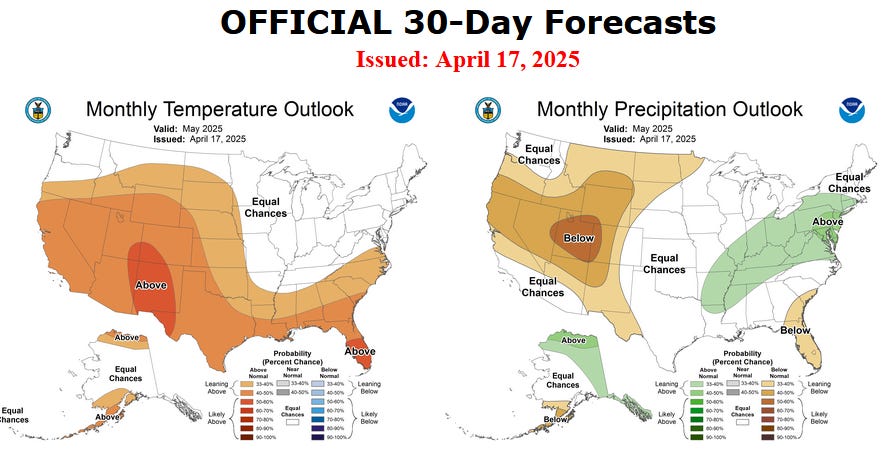
Then we look at a graphic showing the next month and the next three months.

The top row is what is now called the Mid-Month Outlook for next month which will be updated at the end of this month. There is a temperature map and a precipitation map. The second row is a three-month outlook that includes next month. I think the outlook maps are self-explanatory. What is important to remember is that they show deviations from the current definition of normal which is the period 1991 through 2020. So this is not a forecast of the absolute value of temperature or precipitation but the change from what is defined as normal or to use the technical term "climatology".
Notice that the Outlook for next month and the three-month Outlook are fairly but by no means totally similar. This tells us that June and July will be for most areas the same as May.
The full NOAA Seasonal Outlook extends through May/June/July of 2026 (yes that is more than a year out). All of these maps are in the body of the article. Large maps are provided for May and the three-month period May/June/July. Small maps are provided beyond that through May/June/July of 2026 with a link to get larger versions of these maps. NOAA provides a discussion to support the maps. It is included in the body of this article.
Here are larger versions of the Temperature and Precipitation Outlook maps for next month. Remember that these maps will be updated at the end of this month.

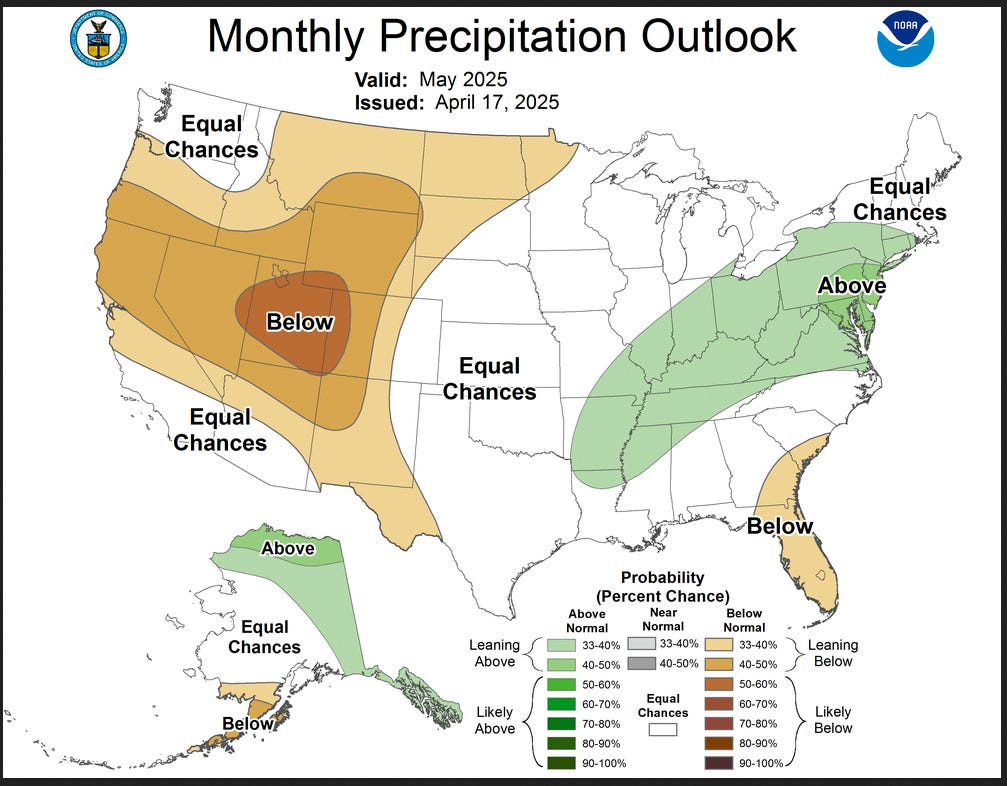
The maps are pretty clear in terms of the outlook.
And here are large versions of the three-month MJJ 2025 Outlooks
First temperature followed by precipitation.


These maps are larger versions of what was shown earlier. This is a pretty definitive pattern.
Looking ahead a bit to think about summer with respect to precipitation:

You see a good Monsoon but limited to the primary area of the North American Monsoon and a somewhat predictable below normal precipitation to the north and in the North and Central Plains States. But the Outlook for Texas is normal. The East Coast and much of the Gulf of Mexico (now renamed the Gulf of America) will be wetter than normal.
NOAA Discussion
Maps tell a story but to really understand what is predicted to happen, you need to read the discussion. I combine the 30-day discussion with the long-term discussion and rearrange it a bit and add a few additional titles (where they are not all caps the titles are my additions). Readers may also wish to take a look at the article we published last week on the NOAA ENSO forecast. That can be accessed HERE. It discusses in Part III of that article possible changes in the ENSO Cycle which may be a result of Global Warming. I have more work to do on that topic but it could be very important. Right now we simply see difficulty in measuring the La Nina Phase of the cycle. It is very possible that the measurement difficulty suggests something much more significant.
I will use bold type to highlight some especially important things. All section headings are in bold type; my comments, if any, are enclosed in brackets [ ].
CURRENT ATMOSPHERIC AND OCEANIC CONDITIONS

The most recent seasonal mean Niño 3.4 index value for January through March is -0.4 degrees Celsius (C), and the most recent weekly mean sea surface temperature (SST) anomaly for the Niño 3.4 region is -0.1 C, as the equatorial Pacific is warming in recent weeks. A small reservoir of colder than average ocean temperatures below the surface remains near the Date Line at a depth of 50 to 200 meters. However, subsurface negative temperature anomalies present several weeks ago in the Eastern Pacific have mostly disappeared. Positive SST anomalies persist near the equator in the Western Pacific with anomalies exceeding +2.0 degrees C at depths of 100 to 200 meters. Outgoing longwave radiation (OLR) anomalies are negative, indicating suppressed convection, near the Date Line. Low-level (850-hPa) wind anomalies remain easterly over the west-central tropical Pacific Ocean. Upper-level (200-hPa) wind anomalies are westerly over the central equatorial Pacific. Most recent, short term, atmospheric and oceanic anomalies are indicative of ENSO-neutral conditions. Negative soil moisture anomalies are observed across much of the Southwest, as well as the Central and Northern Plains. A constructed analog (CA) statistical forecast for the MJJ season from the present soil moisture anomaly pattern predicts associated positive temperature anomalies in the West and weaker negative temperature anomalies over the Central Mississippi Valley. Enhanced precipitation relative to climatology is predicted for parts of the Southwest Monsoon region in Arizona and New Mexico, while persistent negative precipitation anomalies are predicted over the northwestern and north-central CONUS. Enhanced precipitation over much of the eastern CONUS is associated with the CA of soil moisture.

Negative SST anomalies, likely related to residual sea ice, are observed near the west coast of Mainland Alaska, while positive SST anomalies are present around the Alaska Peninsula and along the south and southeast coasts. Positive SST anomalies are observed near the Pacific coast of the CONUS. Negative SST anomalies are presently near the coast of the Mid-Atlantic. Positive SST anomalies are observed near the Gulf Coast. Persistent coastal SST anomalies may influence seasonal temperatures of adjacent areas.

PROGNOSTIC DISCUSSION OF SST FORECASTS

SST forecasts from most North American Multi-Model Ensemble (NMME) dynamical models and from most statistical models, including the CPC Constructed Analog (CA) and Canonical Correlation Analysis (CCA) predict near average SST anomalies for the Niño 3.4 region in the the MJJ season. A consolidation of dynamical and statistical forecasts for the Niño 3.4 region predicts continuation of ENSO-neutral SST anomalies between negative and positive 0.5 degrees C through the boreal summer seasons. The CA and CCA predict increasingly negative Niño 3.4 SST anomalies for next autumn and winter, associated with a possible La Niña. However, the uncertainty in Niño 3.4 SST forecasts at longer leads is fairly large for these seasons. The emergence of El Niño conditions this year is considered less likely than La Niña or ENSO-neutral conditions.

30-DAY OUTLOOK DISCUSSION FOR MAY 2025

The May 2025 outlooks are issued against the backdrop of transition from the cold phase to the neutral phase of the El Niño Southern Oscillation (ENSO). The latest Niño 3.4 weekly sea surface temperature (SST) departures stood at -0.1 degrees Celsius which puts us firmly in ENSO-Neutral territory. ENSO-neutral conditions are expected to continue during the month of May. Meanwhile, the magnitude of the Real-time Multivariate (RMM) based Madden Julian Oscillation (MJO) index is weak. However, there is some evidence of a re-emergence of the MJO across the Western Pacific by late April. Uncertainty in this signal is high due to potential Kelvin Wave interference with this potential MJO re-emergence. Due to the current weakness and uncertainty in its evolution, the MJO did not play a major role in the May 2025 outlook. Farther to the north, across the extratropics of the Northern Hemisphere, the Arctic Oscillation (AO), the North Atlantic Oscillation (NAO), and the Pacific North America (PNA) index have all been positive for much of the past 10 days. However, all have trended less positive during the past few days with the AO and NAO both negative as of the most recent observations. Combined natural analog composites derived from the recent evolution of tropical and extratropical indices depict a 500-hPa flow pattern dominated by above normal heights across the Aleutians and southwestern Mainland Alaska as well as over the southwestern Contiguous United States (CONUS) for the month of May. Anomalous troughing is generally favored across the Great Lakes and Northeast as well as parts of Southeast Alaska. Meanwhile, trends  during the last 15 years favor above normal heights across most of the eastern CONUS, eastern Alaska, and the Aleutians with trends toward below normal heights across much of the southwestern CONUS and parts of southwestern Alaska. As the sun angle increases during the month of May, antecedent soil moisture conditions become more of a factor in the outlook. Currently, soil moisture deficits are observed across much of the southwestern and southeastern CONUS, much of the Plains, and much of the Mid-Atlantic and Northeast. Soil moisture surpluses are currently observed for much of the Ohio, Tennessee, and Lower Mississippi Valleys, parts of the Upper Great Lakes, and parts of northern California and Oregon. Sea surface temperatures (SSTs) are currently above normal adjacent to the South Coast of Alaska, much of the West and Gulf Coasts of the CONUS, and the southern half of the Eastern Seaboard. Below normal SSTs are observed near the Northeast/northern Mid Atlantic coasts and near extreme southern California. Natural analog composites, trends, and dynamical guidance from the Copernicus Climate Change Service (C3S), North American Multi-Model Ensemble (NMME), the Couple Forecast System Version 2 (CFSv2), and the Forecast Consolidation Tool (CON) (which includes both dynamical model input and statistical guidance) form the basis of the May outlooks. The latest CPC Weeks 3-4 Outlooks and associated ensemble guidance from the European Centre for Medium Range Weather Forecasts (ECMWF), Global Ensemble Forecast System (GEFS), and the CFS also contributed. Antecedent conditions such as extratropical SSTs, sea ice extent, and soil moisture conditions were also considered where appropriate.

Temperature

Above normal temperatures are favored for most of the western CONUS, consistent with anomalous ridging. The strongest probabilities (greater than 50 percent) of above normal temperatures are indicated from western portions of the Rio Grande Valley northward to the Four Corners region, where dynamical and statistical guidance show the strongest agreement. A tilt toward above normal temperatures also extends northeastward to parts of the Northern and Central Plains consistent with observed below normal soil moisture. Probabilities of warmer than normal conditions are tempered across parts of the northwestern CONUS, due to cold signals depicted by ENSO-based natural analogs. Farther to the south and east, enhanced above normal temperature probabilities are indicated across the Southern Plains, Lower Mississippi Valley, and the Southeast, due to generally good agreement among dynamical and statistical model guidance. Probabilities of above normal temperatures exceed 40 percent for much of the Gulf Coast region and Southeast and exceed 50 percent over southern Florida, where SSTs in adjacent waters are warmer than normal. Equal chances (EC) of above, near, and below normal temperatures are indicated for the Northeast, Great Lakes, northern Mid Atlantic, as well as the Upper and Middle Mississippi Valley, the Ohio Valley, and the Tennessee Valley. Dynamical models generally depict warm or weak signals  in these areas while statistical guidance generally favors cooler outcomes. Above normal soil moisture across the Ohio, Tennessee, and parts of the Middle and Lower Mississippi valleys reduce chances of above normal temperatures across these areas. Similarly, below normal SSTs adjacent to the northern Mid-Atlantic and Northeast increase chances of back-door cold fronts common for this time of year, resulting in a reduction of above normal temperature probabilities relative to what is depicted by dynamical model guidance such as the NMME and C3S and recent trends. Above normal temperatures are favored for southwestern Alaska and the North Slope, consistent with the consensus of dynamical and statistical model guidance. Above normal SSTs and below normal Arctic sea ice also contributed to increased above normal temperature probabilities for these areas. However, EC is indicated for much of the remainder of Alaska due to conflicting signals among dynamical and statistical model guidance and as well as the presence of lingering sea ice adjacent to parts of western mainland Alaska.

Precipitation

Above normal precipitation is favored across the northern Mid-Atlantic region and southern portions of the Northeast, extending southwestward across the Ohio Valley and parts of the Lower and Middle Mississippi Valleys. The wetness across parts of the Mid-Atlantic and Northeast aligns with CPC’s Weeks 3-4 outlooks, the final consolidation (for the Mid-Atlantic), and the potential for anomalous troughing depicted by the natural analogs. The southwestern extension of the area of enhanced above normal precipitation probabilities across much of the Ohio and Middle and Lower Mississippi Valleys is driven largely by abnormally high soil moisture content. Conversely, below normal precipitation is likely across much of the West due to good agreement among dynamical model guidance, natural analogs, and CPC’s weeks 3-4 guidance. An tilt toward below normal precipitation extends to much of the Northern Plains consistent with currently observed below normal soil moisture. Similarly, a slight tilt toward below normal precipitation is indicated for much of Florida and adjacent areas of the Southeast consistent with below normal soil moisture and CPC’s weeks 3-4 outlooks. Farther to the north, below normal precipitation is favored for southwestern Alaska consistent with CON guidance and increased ridging suggested by the natural analogs. A weak tilt toward above normal precipitation is indicated for eastern and northern Alaska due to monthly guidance from the CON, C3S, and recent trends.

SUMMARY OF THE OUTLOOK FOR NON-TECHNICAL USERS (Focus on May through July)

At present, the El Niño Southern Oscillation (ENSO) is neutral, after La Niña conditions diminished through last month. ENSO-neutral conditions are highly likely for the first lead of the CPC Seasonal Outlook, with the CPC consensus ENSO outlook indicating greater than an 80 percent probability. ENSO-neutral conditions are expected to persist into summer with probabilities exceeding 50 percent.

Temperature

The May-June-July (MJJ) 2025 temperature outlook favors above-normal temperatures for southern and eastern regions of Alaska. Above-normal temperatures are likely for the western Contiguous U.S. (CONUS), across the Southern Plains into the Gulf Coast region, and for the Northeast. Above-normal temperatures are favored with weaker probabilities for much of the Central Plains, the Central Mississippi Valley, the central Great Lakes region, and the Ohio and Tennessee Valleys, with probabilities for above-normal temperatures below 50 percent. Equal Chances (EC) of below, near, and above-normal seasonal mean temperatures are indicated for parts of the northern central CONUS.

The MJJ 2025 precipitation outlook slightly favors above-normal precipitation across most of Alaska, excluding the Aleutians, parts of the southwestern Mainland, and Southeast Alaska. The outlook favors below-normal precipitation across most of the West from the Pacific Coast to most of the Great Plains. Above-normal precipitation is slightly favored for a small area of Arizona and New Mexico near the Mexico border [Author's Note: Presumably the start of the North American Monsoon], while EC is indicated for most of the region from Southern California to western New Mexico and Texas. Above-normal precipitation is favored for the central and eastern Gulf Coast northward up the central Atlantic coast into the northeastern CONUS. For the remaining areas of the central CONUS, where possible seasonal total precipitation amounts are predicted to be similar to climatological probabilities, EC is forecast.

BASIS AND SUMMARY OF THE CURRENT LONG-LEAD OUTLOOKS
Note: For Graphical Displays of the Forecast Tools Discussed Below See:
http://www.cpc.ncep.noaa.gov/products/predictions/90day/tools/briefing

PROGNOSTIC TOOLS USED FOR U.S. TEMPERATURE AND PRECIPITATION OUTLOOKS
The seasonal temperature and precipitation outlooks are based primarily on forecast tools derived from the NMME, including calibrated versions, such as the Probability Anomaly Correlation (PAC) and the Calibration, Bridging and Merging (CBaM), which calibrates the dynamical model forecast using Bayesian Joint Probability (BJP) models, as well as generating statistical or “bridging” BJP models of temperature and precipitation from dynamical model Niño 3.4 anomaly forecast predictors. An ENSO-OCN forecast tool is used to represent the combined influence of the El Niño Southern Oscillation (ENSO) and decadal timescale trends  in temperature and precipitation, using the Optimum Climate Normal (OCN). The presence and forecast of ongoing ENSO-neutral conditions means that longer timescale decadal variability in temperature and precipitation are generally the largest predictable signal for the seasonal forecasts. Decadal variability and trends  are determined from the OCN, representing the difference between the most recent 15-year period average seasonal temperature or precipitation and the average for the climatology period, from 1991-2020. Outlooks for the cold seasons, from October-November-December (OND) through March-April-May (MAM), are in part influenced by the greater likelihood of a La Niña relative to the likelihood of an El Niño. A consolidation of multiple statistical and dynamical forecast tools that utilizes PAC calibration is used throughout the outlooks from MJJ 2025 to MJJ 2026.

PROGNOSTIC DISCUSSION OF OUTLOOKS - MJJ 2025 TO MJJ 2026

TEMPERATURE

The MJJ 2025 seasonal temperature outlook favors above-normal temperatures for much of Alaska, excluding the west coast of Mainland Alaska where EC is indicated, due in part to adjacent negative SST anomalies. Above-normal temperatures continue to be favored through the August-September-October (ASO) season for Mainland and Southeast Alaska, supported primarily by NMME forecasts. Areas where EC is indicated expand in later leads where signals are weaker in forecast tools, such as the ENSO-OCN. Decadal variability leads to a signal for above-normal temperatures for parts of the west and north coasts through the coming year.

Above-normal temperatures are favored across nearly all of the CONUS through the first five seasonal leads, with higher probabilities for the West, the southern CONUS, and the Northeastern CONUS, supported by dynamical model forecasts and the temperature consolidation. An area of EC is indicated for the north-central CONUS in the MJJ 2025 season, where statistical tools and calibrated dynamical models  indicate lower chances of above-normal temperatures. Weaker probabilities favoring above-normal temperatures are also forecast for the Central Mississippi and Ohio Valleys, related to statistical guidance such as the soil moisture CA tool. Decadal variability and forecast guidance from the ENSO-OCN tool leads to favored above-normal temperatures across the CONUS for June-July-August (JJA) 2025 through ASO 2025. An area of EC emerges and expands across much of the north-central and northwestern CONUS in the next several leads into the start of winter, related to the relative greater chances of ENSO-neutral and La Niña conditions compared to El Niño conditions. During the upcoming winter, December-January-February (DJF) through early spring of 2026, February-March-April (FMA), slightly enhanced probabilities for below-normal temperatures appear in parts of the Northwest. The longest lead seasonal outlooks through MJJ 2026 are based primarily on signals due to decadal variability as shown by the OCN tool.

PRECIPITATION

The MJJ though ASO 2025 precipitation outlooks favor above-normal precipitation for most of Mainland Alaska, supported primarily by dynamical model forecasts from the NMME and by decadal trends  for most areas. Signals  for above-normal precipitation are more confined to western and northern regions of Alaska for the seasons that follow, relying on the ENSO-OCN tool and primarily resulting from decadal trends. Although greater precipitation is historically associated with cooler temperatures in many areas, decadal trends  tend to favor both above-normal temperatures and above-normal precipitation, driven in part by anomalous decreasing sea ice and warmer ocean water temperatures.

Below-normal precipitation is favored across most of the western and central CONUS, excluding the southwestern CONUS, in the MJJ and JJA 2025 seasons, supported by both dynamical and statistical model forecasts and the consolidation. The area of favored below-normal precipitation is more confined to the northern central CONUS in longer leads through September-October-November (SON) 2025, as the signal decreases in forecast tools. A small area of enhanced probabilities for above-normal precipitation emerges in the Southwest in the outlook for MJJ 2025 and expands and persists through the ASO 2025 season. The likelihood of an enhanced Southwest Monsoon is increased due to current negative soil moisture anomalies and predicted above-normal temperatures. Above-normal precipitation is favored for parts of the Gulf and Atlantic Coasts for MJJ through SON 2025, supported primarily by the consolidation of dynamical and statistical models. Enhanced seasonal precipitation is in part associated with above average tropical Atlantic SSTs and predicted ENSO-neutral conditions.

In the late autumn of 2025 through early spring of 2026, precipitation signals are associated with decadal trends, decreased chances of El Niño conditions, and favored ENSO-neutral or La Niña conditions. This leads to enhanced probabilities for below-normal precipitation for parts of the eastern Gulf and Atlantic Coasts from NDJ 2025 through FMA 2026 and for parts of the Southwest near the Mexico border from DJF through MAM 2026. Probabilities for above-normal precipitation are enhanced for parts of the Northern Rockies and northwestern CONUS from NDJ 2025 though FMA 2026 and for parts of the Midwest from DJF through FMA 2026. At the two longest leads, the seasonal outlooks favor below normal precipitation for parts of the northwestern CONUS, entirely due to reliable signals from decadal trends. EC is indicated for remaining areas of the CONUS and Alaska, where signals are weak.
* From the Tools discussion at https://origin.cpc.ncep.noaa.gov/products/predictions/90day/tools.html.
OCN - THE OPTIMAL CLIMATE NORMALS METHOD PREDICTS T AND P ON THE BASIS OF YEAR-TO-YEAR PERSISTENCE OF THE OBSERVED AVERAGE ANOMALIES FOR A GIVEN SEASON DURING THE LAST 10 YEARS FOR T - AND THE LAST 15 YEARS FOR P. OCN EMPHASIZES LONG-TERM TRENDS AND MULTI-YEAR REGIME EFFECTS. OCN FORECASTS ARE AVAILABLE FOR ALL 13 FORECAST PERIODS - BUT ARE NOT YET AVAILABLE FOR HAWAII.
This is confusing as it differs from the standard definition of climatology provided by NOAA but it is more practical and appears to be a change in the methodology used by NOAA which we discussed last month.
Drought Outlook
NOAA also issues a Seasonal Drought Outlook which is tied to the precipitation and temperature outlooks plus the initial conditions. That means among other things that current soil conditions need to be considered when doing a drought forecast.

The yellow is the bad news, and there is a fair amount of it. And there is a very large area where drought is expected to persist. The area where drought is expected to improve is almost as large as the area where new drought is expected to occur. Overall, the level of drought is expected to increase a bit. We will talk about the implications of the Outlook on the water situation in the West and Northern Plains in separate articles.
Short CPC Drought Discussion
Latest Seasonal Assessment - Our drought tendency forecast through the end of July 2025 is divided into two sections across the contiguous United States, on either side of a line extending from Lake Michigan to central Illinois to the Gulf Coast. To the east, existing areas of drought are expected to improve or be removed completely by the end of the period. Most of these areas are in or near the Atlantic Seaboard, where the 3-Month May-July 2025 outlook favors above-normal precipitation.
To the west of this line, existing drought areas are expected to persist or intensify across the Northwest, the Southwest, portions of the Rockies, much of the Plains, and parts of the adjacent Midwest. There are enhanced odds for subnormal May-July precipitation through almost all of these areas, prompting a forecast for expanding drought in adjacent areas of the Plains where drought is not yet depicted. The exception is across the southern and east-central Great Plains, where heavy precipitation during the last half of April may preclude eventual development even if May-July rainfall is below normal.
The May-July outlook slightly favors above-normal precipitation in parts of southern Arizona and New Mexico. These areas are typically very dry during May and June, with a sharp increase in rainfall during July when the Southwest Monsoon normally kicks in. Therefore, the May-July outlook is almost entirely dependent on the early evolution of the Southwest Monsoon in July. Currently, entrenched drought is established in this region, and even if the monsoon starts off robustly, it likely won't bring sufficient amounts of rain to alter the drought depiction. During the ensuing months, there may be a better chance for improvement if the monsoon turns out to be unusually wet overall.
In Hawaii, drought areas on the Big Island are expected to persist, as is the case in most of the leeward sections of the remainder of the state. Precipitation is expected to be more robust in windward areas and over some of the larger cities, prompting forecasts for improvement or removal there. No drought development is forecast elsewhere across the state. Alaska, Puerto Rico, and the Virgin Islands are expected to remain drought-free, although the abnormal dryness existing across the northern Virgin Islands will need to be monitored closely.
Looking out Four Seasons.
Twelve Temperature Maps. These are overlapping three-month maps (larger versions of these and other maps can be accessed HERE)

Comparing the new outlook with the prior Outlook,
Another useful way of looking at this is to compare the new set of 12 overlapping three-month maps with the prior set issued last month.

The easiest way to do the comparison is to print out both maps. If you have a color printer that is great but not needed. What I do is number the images from last month 1 - 12 starting with "1" and going left to right and then dropping down one row. Then for the new set of images, I number them 2 - 13. That is because one image from last month in the upper left is now discarded and a new image on the lower right is added. Once you get used to it, it is not difficult. In theory, the changes are discussed in the NOAA discussion but I usually find more changes. It is not necessarily important. I try to identify the changes but believe it would make this article overly long to enumerate them. The information is here for anyone who wishes to examine the changes.
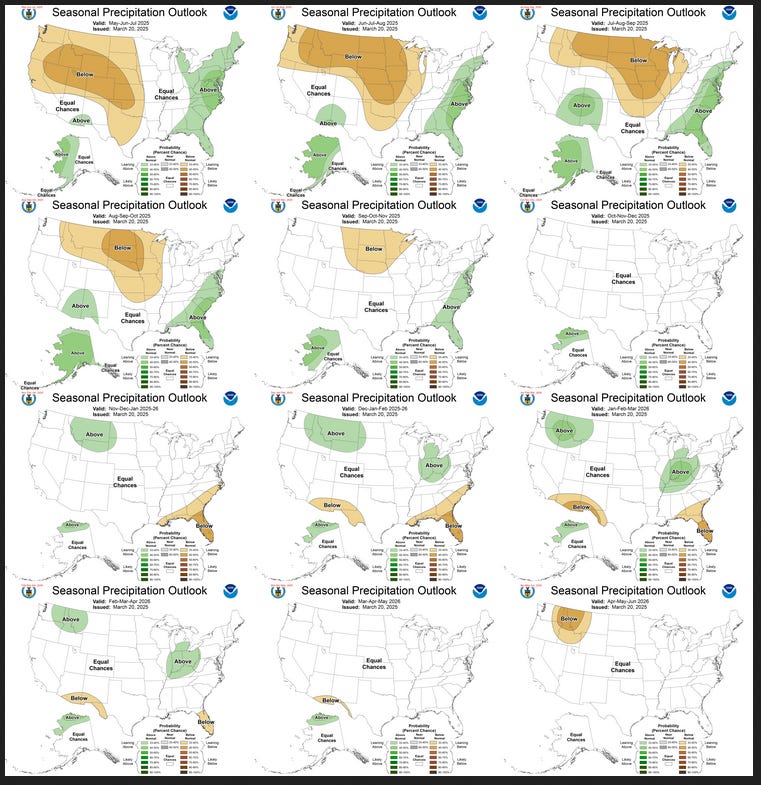
Now the Twelve New Precipitation Maps
Similar to Temperature in terms of the organization of the twelve overlapping three-month outlooks.

Comparing the new outlook with the prior Outlook,
As with temperature, another useful way of looking at this is to compare the new set of 12 overlapping three-month maps with the prior set.
A good approach for doing this comparison is provided with the temperature discussion.
The key piece of information used by NOAA follows.
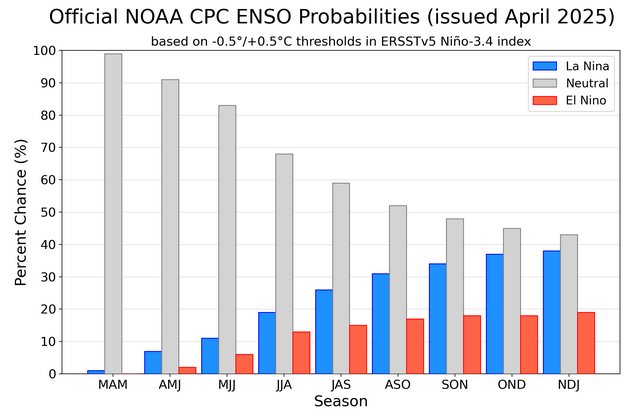
This type of graphic does not show how strong an El Nino or a La Nina is likely to be but the probability of the three phases of ENSO. What is forecast is that ENSO Neutral is likely to return soon (if not here already) but with lagging impacts of the La Nina. In the Spring, the reliability of forecasting the phase of ENSO for the next winter is low but as shown here, a second La Nina winter is possible.
Resources
You can also find these maps individually on the CPC.NCEP Main Page. You can get to a lot of places from there but to make it easy here is the monthly discussion and here is the long-term discussion which includes the state of the Atmosphere. I have shown it in the text earlier in this article.
The image showing the Early Outlook for the subsequent month and the three-month outlook can be obtained by Clicking Here.
All of the three-month maps and the graphic that shows all twelve of them can be found here. It extends out for 12 overlapping three-month periods in addition to the most immediate three-month period which is the focus of this report. I like this graphic as you can see the forecast change in the pattern as the phases of ENSO come and go plus factoring in the seasonal trends.
The link for the drought outlook map and some discussions that come with the map can be found by clicking HERE.
Other Reports and Information
The Wildfire Forecast can be accessed HERE It will be updated in early May so it is best to look for it then.
I hope you found this article interesting and useful.
