


The NOAA Four-Season Weather Outlook Issued on June 19, 2025 has Changed for July and the Next Three Months and the Winter Outlook is Uncertain
Low Confidence in the Outlook for the Southwest Monsoon which Impacts the Outlook for Many States and the ENSO phase for the Coming Winter is Not Clear.

On the third Thursday of the month, right on schedule, NOAA (really their Climate Prediction Center CPC) issued its updated Seasonal Outlook, which I describe as its Four-Season Outlook because it extends a bit more than one year into the future. The information released also included the Mid-Month Outlook for the following month, plus the weather and drought outlook for the next three months. I present the information issued by NOAA and try to add context to it. It is quite a challenge for NOAA to address the subsequent month, the subsequent three-month period as well as the twelve successive three-month periods for a year or a bit more.
We are now classified as experiencing ENSO Neutral conditions. The MJO is expected to be a non-factor. Thus, predictive ability is less than usual for the near-term.
Let's Take a Look at the (mid-month) Outlook for July.
It will be updated on the last day of June.

Then we look at a graphic showing the next month and the next three months.

The top row is what is now called the Mid-Month Outlook for next month, which will be updated at the end of this month. There is a temperature map and a precipitation map. The second row is a three-month outlook that includes next month. I think the outlook maps are self-explanatory. What is important to remember is that they show deviations from the current definition of normal, which is the period 1991 through 2020. So this is not a forecast of the absolute value of temperature or precipitation, but the change from what is defined as normal, or to use the technical term, "climatology".
Notice that the Outlook for next month and the three-month Outlook are fairly similar, but not totally similar. This tells us that August and September will be, for most areas, the same as July. With respect to temperature, where July is shown as EC, August and September may need to have higher probabilities of being warmer than normal to make the three-month outlook turn out to be correct. This is a good point to repeat (I think I have stated this before) that the outlook provides probabilities of being different from normal, not the absolute difference in temperature or precipitation. As one can see by the explanation of OCN that follows this month’s NOAA discussion that the definition of “Normal” is a bit fluid.
The full NOAA Seasonal Outlook extends through July/August/September of 2026 (yes, that is more than a year out). All of these maps are in the body of the article. Large maps are provided for July and the three-month period July/August/September. Small maps are provided beyond that through July/August/September of 2026, with a link to get larger versions of these maps. NOAA provides a discussion to support the maps. It is included in the body of this article.
Here are larger versions of the Temperature and Precipitation Outlook maps for next month. Remember that these maps will be updated at the end of this month.
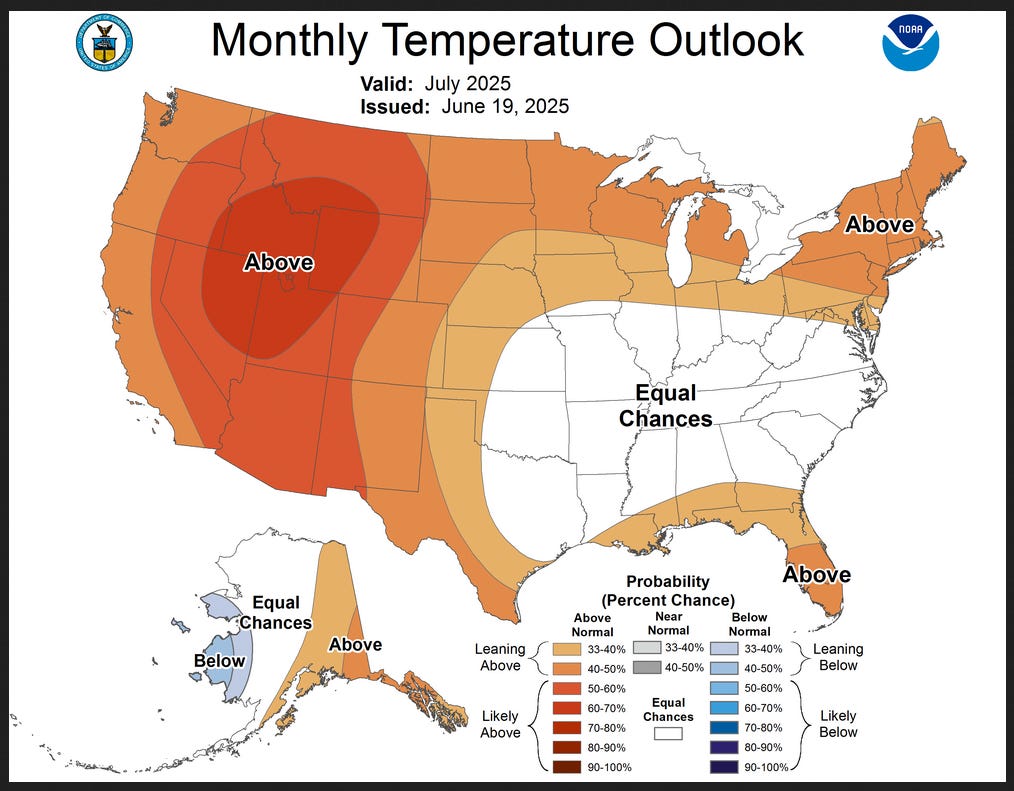

The maps are pretty clear in terms of the outlook.
Here are large versions of the three-month JAS 2025 Outlooks
First temperature followed by precipitation.
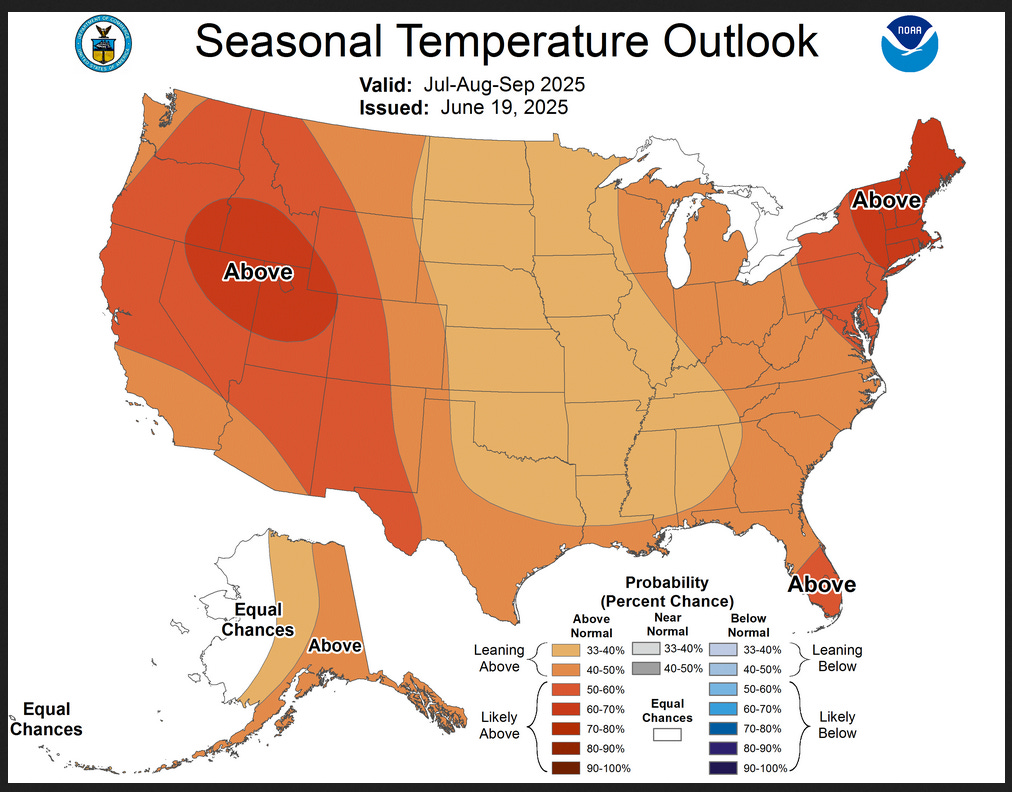

These maps are larger versions of what was shown earlier.
Arizona is no longer projected to have an above-average monsoon. The Great Plains are no longer projected to be drier than normal, which is probably related to the change in outlook for the Southwest Monsoon. The dry area is in the Northwest, which is not a change. The East Coast and the Gulf states will be wetter than normal.
NOAA Discussion
Maps tell a story, but to really understand what is predicted to happen, you need to read the discussion. I combine the 30-day discussion with the long-term discussion and rearrange it a bit, and add a few additional titles (where they are not all caps, the titles are my additions). Combining the two discussions results in some redundancy but I want to have the outlook for the coming month explained in detail.
Readers may also wish to take a look at the article we published last week on the NOAA ENSO forecast. That can be accessed HERE.
I use bold type to highlight some especially important things. All section headings are in bold type; my comments, if any, are enclosed in brackets [ ].
CURRENT ATMOSPHERIC AND OCEANIC CONDITIONS
Weekly observed SSTs in the Niño 3.4 region are average with small positive SST anomalies closer to the South American coast. Since late April, subsurface temperature anomalies (averaged from 180-100W and 0-300 meters) are slightly above-average. From May 20, 2025 to June 14, 2025, negative outgoing longwave radiation (OLR) anomalies (enhanced convection and precipitation) continued over Indonesia and northern Australia. Near average OLR anomalies were present throughout the rest of the equatorial Pacific. Both the low-level (850-hPa) and upper-level (200-hPa) wind anomalies were near average across the central equatorial Pacific. These atmospheric and oceanic conditions reflect ENSO-neutral conditions.
The Madden-Julian Oscillation (MJO) has generally remained weak and incoherent during the late spring as other modes of tropical variability (fast-moving Kelvin waves and equatorial Rossby waves) dominate. The GEFS and ECMWF models favor a continued weak MJO heading into July with fast-moving Kelvin waves the primary influence on anomalous tropical rainfall and tropical cyclone development.
PROGNOSTIC DISCUSSION OF SST FORECASTS
The CPC SST consolidation forecast for Niño 3.4 depicts ENSO-neutral conditions persisting through August-September-October (ASO) as SST anomalies remain between 0 and -0.5 degrees C. Later in the fall and heading into the early winter, dynamical models and statistical tools diverge on the ENSO state. In addition, ensemble spread among the NMME members becomes large at the same time. Most of the International Multimodel Ensemble (C3S) members favor ENSO-neutral conditions persisting through the fall. The CPC ENSO outlook indicates that ENSO-neutral is likely during JAS (near 70 percent chance) but those probabilities decline closer to 50 percent by the fall season. During the 2025-2026 winter (DJF), either ENSO-neutral or La Niña is the most likely outcome. [Author’s Note: This is very important]
30-DAY OUTLOOK DISCUSSION FOR JULY 2025
The July 2025 temperature and precipitation outlooks are primarily based on a combination of dynamical model guidance [both Week 3-4 and integrated monthly (North American Multi-Model Ensemble (NMME), Copernicus multi-model ensemble system (C3S))], statistical forecast guidance, and current surface conditions. Although there has been considerable coherent subseasonal tropical variability in the form of atmospheric Kelvin wave activity, the Madden-Julian Oscillation (MJO) has weakened substantially from its state in late May and early June. Moreover, forecasts of the MJO over the next few weeks do not predict any clear, reliable strengthening of the signal and so the MJO does not play a role in preparation of the July outlooks. Current land surface states such as anomalous soil moisture did contribute considerably to the outlooks for the upcoming month.
Temperature
The temperature outlook favors above-normal monthly mean temperatures for the western half of the contiguous U.S. as well as eastward across the northern Plains, upper Mississippi Valley, Great Lakes, and Northeast. Above-normal temperatures are also favored along the Gulf coast, including all of Florida, and for Southeast Alaska. Probabilities are greatest for the western U.S. where warmer than normal conditions are overwhelmingly favored by both dynamical and statistical model guidance, long-term positive temperature trends , and drier than normal surface conditions in many areas. The odds for above-normal temperatures across the northern tier of the U.S. from the Plains to the Northeast are lower due to somewhat less agreement in model guidance and varying surface conditions.
Warmer than normal sea surface temperatures (SSTs) and some forecast tools favor a slight tilt toward above-normal temperatures for the Gulf coast and Florida.
Ocean surface temperatures and potential weak ridging in dynamical model guidance elevates odds slightly for warmer than normal temperatures in proximity to Southeast Alaska. Alternatively, forecast troughing during the first half of July and cooler than normal SSTs in the Bering Sea favors an area of below-normal temperatures for a small region in Southwest Mainland Alaska.
Precipitation
A large area of quite wetter than normal surface conditions from frequent and heavy precipitation events this late winter and spring were observed from the south-central Plains eastward to the Atlantic seaboard. This is likely to offset, to some degree, periods of warmer than normal conditions during July and interject considerable uncertainty for the eventual July monthly mean temperatures. So a forecast for "Equal-Chances" (EC) of either of the three categories is forecast from the Plains eastward across the mid-South, Tennessee Valley, lower Ohio Valley and Carolinas.
For precipitation, both dynamical and statistical model guidance, long-term negative precipitation trends , in some areas, and drier than normal surface conditions support elevated odds for below-normal July monthly total precipitation amounts for the Pacific Northwest, northern Rockies and the northern and central Plains. The most likely area for drier than normal conditions is for parts of Montana, Idaho and Wyoming.
Forecast troughing during the first half of July centered in the Bering Sea supports elevated odds for above-normal precipitation for much of western Mainland Alaska. The majority of NMME and C3S monthly precipitation forecasts are consistent with this wet signal.
Long-term positive precipitation trends and NMME and C3S monthly dynamical model guidance favor above-normal precipitation for the Southeast, Ohio Valley, mid-Atlantic and much of the Northeast. Probabilities are modest overall for this region.
Large variability from both dynamical and statistical model guidance and quite unusual late Spring temperature and precipitation conditions, makes the forecast for the Southwest monsoon region highly uncertain. Given this, the most appropriate forecast in this area for July 2025 is EC as either of the three categories are equally likely given the above information at this point in mid-June. [Author’s Note: This is very important]
SUMMARY OF THE OUTLOOK FOR NON-TECHNICAL USERS (Focus on July through September)
El Niño Southern Oscillation (ENSO)-neutral conditions continue with sea surface temperatures (SSTs) near average over most of the equatorial Pacific Ocean. ENSO-neutral is likely to persist through September (near 70% chance). By the late fall and early winter (November-December-January, NDJ 2025-26), ENSO-neutral is favored but confidence is lower with a 48% chance of ENSO-Neutral and a 41% chance of La Niña.
The July-August-September (JAS) Temperature Outlook favors above-normal temperatures throughout the lower 48 states with the highest forecast confidence across the Great Basin and New England. The JAS outlook only slightly leans towards above-normal temperatures for much of the Great Plains and Mississippi Valley. Above-normal temperatures are also favored for eastern and southern Alaska.
The JAS Precipitation Outlook depicts elevated above-normal precipitation probabilities for the Mid-Atlantic, Southeast, and Upper Ohio Valley. Below-normal precipitation is more likely across the Northern to Central Great Plains, Northern Rockies, and Pacific Northwest. Above-normal precipitation is favored for central and western Alaska.
Areas depicted in white and labeled “Equal-Chances” or “EC” are regions where climate signals are weak, and so there are equal chances for either above-, near- or below-normal seasonal mean temperatures or total precipitation amounts.
BASIS AND SUMMARY OF THE CURRENT LONG-LEAD OUTLOOKS
PROGNOSTIC TOOLS USED FOR U.S. TEMPERATURE AND PRECIPITATION OUTLOOKS
The Temperature and Precipitation Outlooks for JAS 2025 were based on dynamical models such as the North American Multi-Model Ensemble (NMME) and the Copernicus (C3S) multi-model ensemble system. A Calibration, Bridging, and Merging (CBaM) version of the NMME was also used in the outlooks. An objective, historical skill-weighted consolidation that includes the NMME along with statistical tools such as the SST-based Constructed Analog and the ENSO-OCN was used through November-December-January (NDJ) 2025-2026. Beyond that time, the consolidation only includes statistical tools. Long-term climate trends were considered for all leads, but were relied upon most during the 2026 spring and summer.
PROGNOSTIC DISCUSSION OF OUTLOOKS - JAS 2025 TO JAS 2026
TEMPERATURE
The highest forecast confidence for above-normal temperatures (probabilities more than 60 percent) during JAS 2025 is across the Great Basin and New England where there is excellent agreement and consistency among the dynamical models. Although above-normal temperatures are favored throughout the lower 48 states, probabilities are limited (less than a 40 percent chance) across most of the central contiguous U.S. (CONUS). The smaller above-normal temperature probabilities for the Lower Mississippi Valley and Tennessee Valley are consistent with high soil moisture and favored wetness during this three-month period. Above-normal temperatures are most likely across eastern and southern Alaska, while the NMME and nearby negative SST anomalies result in equal chances of below, near, or above-normal temperatures for northwestern Alaska.
Compared to the previous month, the NMME depicts lower above-normal temperature probabilities for the northwestern and north-central CONUS from the late summer through the fall. Beginning in August-September-October, EC of below, near, or above-normal temperatures are forecast for parts of the north-central CONUS and the coverage of EC expands in spatial coverage through the fall. Since ENSO-neutral or La Niña is favored during the late fall and 2025-2026 winter, the temperature outlook generally followed those temperature composites along with the consolidation. [Author’s Note: Presumably they are planning on ENSO Neutral with a La Nina Bias but they are not clear what they are doing]. Elevated below-normal temperature probabilities are forecast for the northwestern CONUS beginning in December-January-February 2025-2026 through February-March-April 2026. Following this, long-term trends became the major factor in the temperature outlook during the 2026 spring and summer.
PRECIPITATION
During JAS 2025, below-normal precipitation remains the most likely outcome for the Pacific Northwest, Northern Rockies, Northern to Central Great Plains, and parts of the Upper Mississippi Valley. The NMME has maintained this dry signal dating back to February. In addition to the good model consistency, the C3S, CBaM, and consolidation support an increased chance of below-normal precipitation for those areas. One notable change in the NMME from one month ago is the lack of a dry signal across the Southern Great Plains. The JAS outlook now calls for EC of below, near, or above-normal precipitation from southern Kansas southward through Oklahoma and much of Texas. Although above-normal precipitation was favored across the Southwest during JAS in previous outlooks, EC of below, near, or above-normal precipitation are now forecast for this region since the July outlook has EC and there is no dynamical model support for leaning towards the wet side. Based on the NMME, C3S, and consolidation, above-normal precipitation is most likely across the Mid-Atlantic and Southeast. Compared to the JAS outlook released in May, the elevated above-normal precipitation probabilities were expanded west to include the Upper Ohio Valley and Tennessee Valley due to changes in the dynamical model output. The NMME and C3S support an increased chance of above-normal precipitation across the western two-thirds of Alaska for JAS.
Similar to JAS, the dry signal among the dynamical models diminished in coverage throughout the central CONUS for August-September-October (ASO) and only a slight lean towards below-normal precipitation (33 to 40 percent chance) is forecast across the Northern to Central Great Plains and Upper Mississippi Valley. A slight lean towards above-normal precipitation was maintained for parts of the Mid-Atlantic and Southeast during ASO and September-October-November (SON) which is consistent with an increased chance of an above-normal Atlantic hurricane season. Also, there is a wet signal in the NMME and C3S during ASO. Since the SST-based Constructed Analog loses the wet signal across the Southwest during ASO and there is no dynamical model support for favoring above-normal precipitation, EC of below, near, or above-normal precipitation are forecast for the Southwest. During November-December-January (NDJ) and December-January-February (DJF) 2025-2026, below-normal precipitation probabilities were slightly increased across the Southeast since the chances for El Niño developing by next winter are only at near 10 percent. EC is forecast for a majority of the forecast domain during the 2026 spring and summer except for an increased chance of below-normal precipitation for parts of the northwestern and north-central CONUS.
* From the Tools discussion at https://origin.cpc.ncep.noaa.gov/products/predictions/90day/tools.html.
OCN - THE OPTIMAL CLIMATE NORMALS METHOD PREDICTS T AND P ON THE BASIS OF YEAR-TO-YEAR PERSISTENCE OF THE OBSERVED AVERAGE ANOMALIES FOR A GIVEN SEASON DURING THE LAST 10 YEARS FOR T - AND THE LAST 15 YEARS FOR P. OCN EMPHASIZES LONG-TERM TRENDS AND MULTI-YEAR REGIME EFFECTS. OCN FORECASTS ARE AVAILABLE FOR ALL 13 FORECAST PERIODS - BUT ARE NOT YET AVAILABLE FOR HAWAII.
This is confusing as it differs from the standard definition of climatology provided by NOAA, but it is more practical and appears to be a change in the methodology used by NOAA, which we discussed recently.
Drought Outlook
NOAA also issues a Seasonal Drought Outlook, which is tied to the precipitation and temperature outlooks, plus the initial conditions. That means, among other things, that current soil conditions need to be considered when doing a drought forecast.

The yellow is the bad news, and there is a fair amount of it, including part of California. And there is a very large area where drought is expected to persist. The area where drought is expected to improve is a bit less than the area where new drought is expected to occur. Overall, the level of drought is expected to increase a bit. We will talk about the implications of the Outlook on the water situation in the West in separate articles.
Short CPC Drought Discussion
Latest Seasonal Assessment - During the past 4 weeks, periodic precipitation across central and eastern portions of the Contiguous U.S. (CONUS) brought widespread drought amelioration (1-3 class improvement) to parts of the Great Plains, Midwest, Mid-Atlantic and Southeast. The onset of the southern moisture flow also improved drought conditions across parts of the Southwest. However, drought and abnormal dryness continued to expand and degrade across parts of the Pacific Northwest, Northern and Central Rockies as of the June 17, 2025 US Drought Monitor.
Looking ahead into the coming July-August-September (JAS) season, the CPC monthly and seasonal outlooks favor drier conditions across much of the Pacific Northwest, eastward into parts of the Northern and Central Plains, and equal chances (EC, above-near-below normal) for the precipitation across much of remainder of the western and central CONUS, coupled with a general dry climatology and near to above normal temperatures across much of the CONUS. Therefore, persistence is forecast for the existing drought across much of the West, with potential drought expansion likely over these abnormal dry (D0) areas. One exception for the West is the core monsoon region in the Southwest. Some improvement is favored due to forecast EC for precipitation across the region coupled with a favorable time of year for soil moisture recharge. Drought improvement is also expected for parts of the Midwest due to forecast heavy precipitation across the region in the next two weeks and EC precipitation for the season. Drought removal across the Florida Peninsula is favored with forecast above normal precipitation for the season coupled with a wet climatology and a favorable time of year for soil moisture recharge. The removal of existing drought in several small areas across the Northeast is favored due to forecast heavy precipitation across the region in the next two weeks and above normal precipitation expected for the season.
Drought persistence is expected across much of the Hawaiian Islands with expansion likely in some abnormal dry (D0) areas in the Leeward side due to the CPC seasonal outlook favoring below normal precipitation and the Islands also in the climatological dry season. No drought conditions are currently present or favored to develop across Alaska, Puerto Rico, or the US Virgin Islands.
Looking out Four Seasons.
Twelve new Three-Month Temperature Maps.
These are overlapping three-month maps (larger versions of these and other maps can be accessed HERE)

Comparing the new outlook with the prior Outlook,

Another useful way of looking at this is to compare the new set of 12 overlapping three-month maps with the prior set issued last month.
The easiest way to do the comparison is to print out both maps. If you have a color printer, that is great, but not needed. What I do is number the images from last month, 1 - 12, starting with "1" and going left to right, and then dropping down one row. Then, for the new set of images, I number them 2 - 13. That is because one image from last month in the upper left is now discarded, and a new image on the lower right is added. Once you get used to it, it is not difficult. In theory, the changes are discussed in the NOAA discussion, but I usually find more changes. It is not necessarily important. I try to identify the changes, but believe it would make this article overly long to enumerate them. The information is here for anyone who wishes to examine the changes.
Now the Twelve New Precipitation Maps
Similar to Temperature in terms of the organization of the twelve overlapping three-month outlooks.

Comparing the new outlook with the prior Outlook,
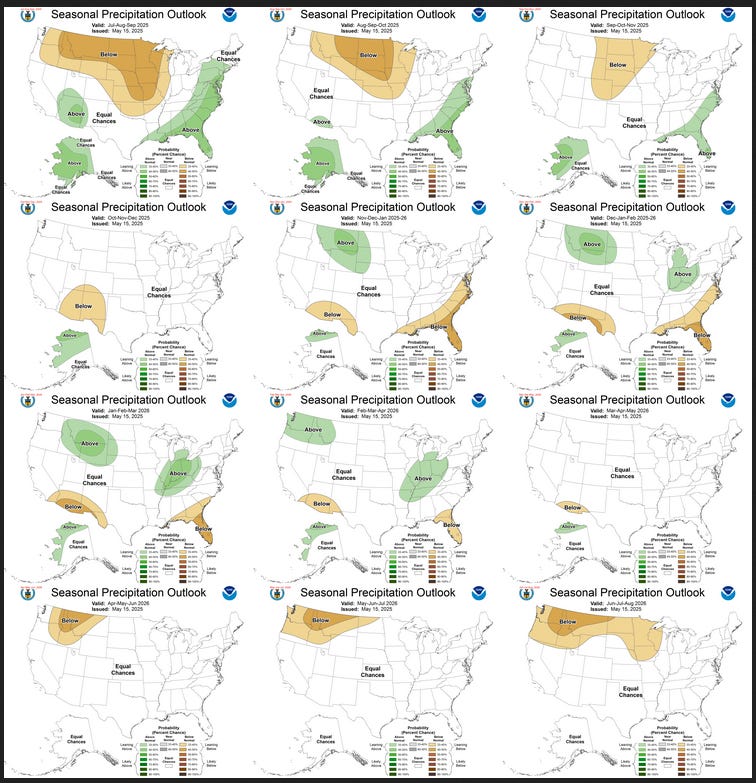
As with temperature, another useful way of looking at this is to compare the new set of 12 overlapping three-month maps with the prior set.
A good approach for doing this comparison is provided with the temperature discussion.
The key piece of information used by NOAA follows.
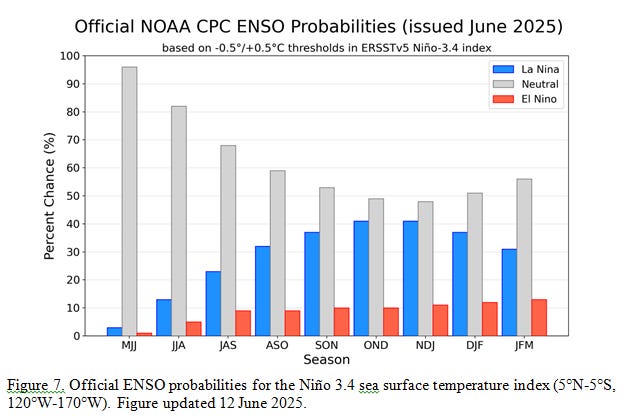
This type of graphic does not show how strong an El Niño or a La Niña is likely to be, but the probability of the three phases of ENSO. What is forecast is that ENSO Neutral will continue for some time. The Phase of ENSO that is expected for the winter is not clear.
Resources
You can also find these maps individually on the CPC.NCEP Main Page. You can get to a lot of places from there, but to make it easy, here is the monthly discussion, and here is the long-term discussion, which includes the state of the Atmosphere. I have shown it in the text earlier in this article.
The image showing the Early Outlook for the subsequent month and the three-month outlook can be obtained by Clicking Here.
All of the three-month maps and the graphic that shows all twelve of them can be found here. It extends out for 12 overlapping three-month periods in addition to the most immediate three-month period. I like this graphic as you can see the forecast change in the pattern as the phases of ENSO come and go, plus factoring in the seasonal trends.
The link for the drought outlook map and some discussions that come with the map can be found by clicking HERE.
Other Reports and Information
The Wildfire Forecast can be accessed HERE It will be updated in early July, so it is best to look for it again then.
I hope you found this article interesting and useful.