


Saturday Newsletter: Wetter, Warmer, Wilder - The Story Behind Europe’s 2024 Climate Extremes
Global Warming generally makes the Earth wetter not drier - But oceans may be generating fewer clouds than expected. It may be more complicated than originally thought.


This Annual Report has been out for a while, but I just recently became aware of it, so I am presenting the Summary of the Report in this article. It also gives me the opportunity to explain that Global Warming generally results in a wetter Earth. The reason for that is that warmer oceans create more evaporation and thus clouds. This is all explained in the IPCC Reports.
But a New Study Reveals an Unexpected Decline in Ocean Evaporation Amid Rising Sea Temperatures. This is explained in the linked article. Learn about the Clausius-Clapeyron relationship.
So, Europe being wet in 2024 is, in general, good news, but the flooding was not good news.
Wetter comes with a catch. If wetter is due to more evaporation over warmer oceans and due to onshore winds, more precipitation over land, it also results in more evaporation over land. It is an acceleration of the hydrologic cycle. We also see shifts in the location of the hydrologic cycle with expanding areas of both drought and perhaps more water than they want..
That is one reason why I often focus on Global Warming, as that is a process that we can more easily forecast. The Warming induces Climate Change, but our ability to predict the changes to the climate is pretty much ineffective, although there is money to be made by those claiming to be able to do it. It is the age-old problem of more variables than equations (you can not solve and get a single answer), but this fact seems to have little impact on those who claim to be able to predict the climate.
Where money and influence can be gained, there are many interested in satisfying the desire of people who wish to know the future. In general, this is positive. Unfortunately, most involved in this type of work do not really know what they are talking about. I grew up in Atlantic City, so I learned about shysters at an early age.
For sure, we have to respond to Climate Change even if our ability to predict it is less than many who do the predicting acknowledge or even understand themselves.
The remainder of this article is a presentation of the Summary of the Copernicus and World Meteorological Organization (WMO) Report on the 2024 climate of Europe, and at the end, I added some additional trend information from my NOAA sources. The full European Climate in 2024 Report can be accessed HERE
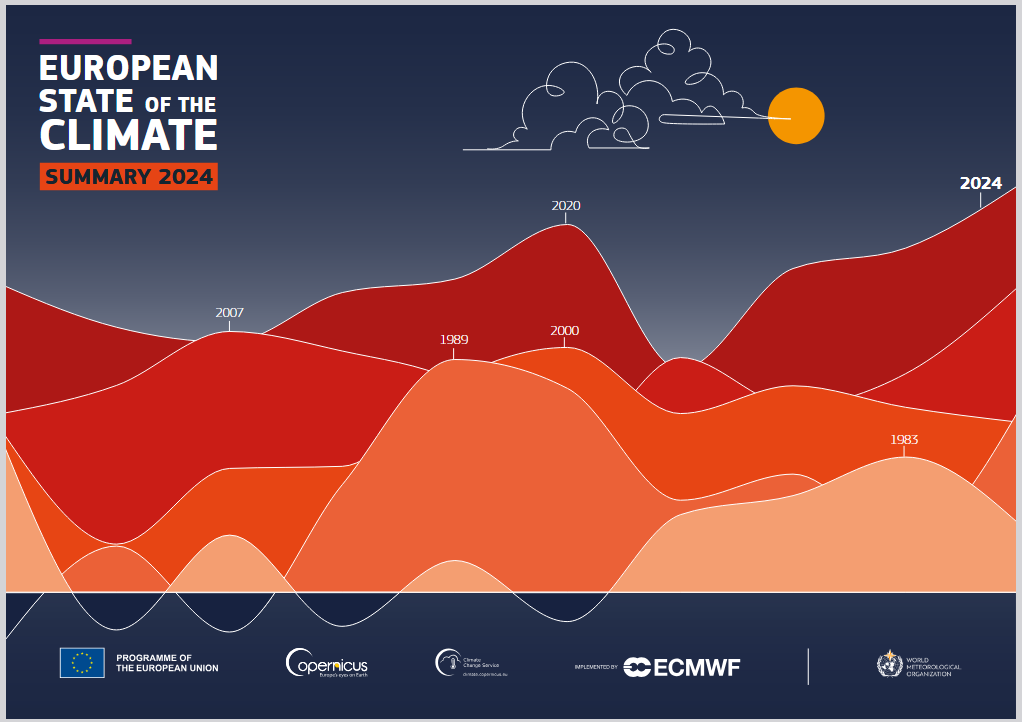


This really summarizes the report.
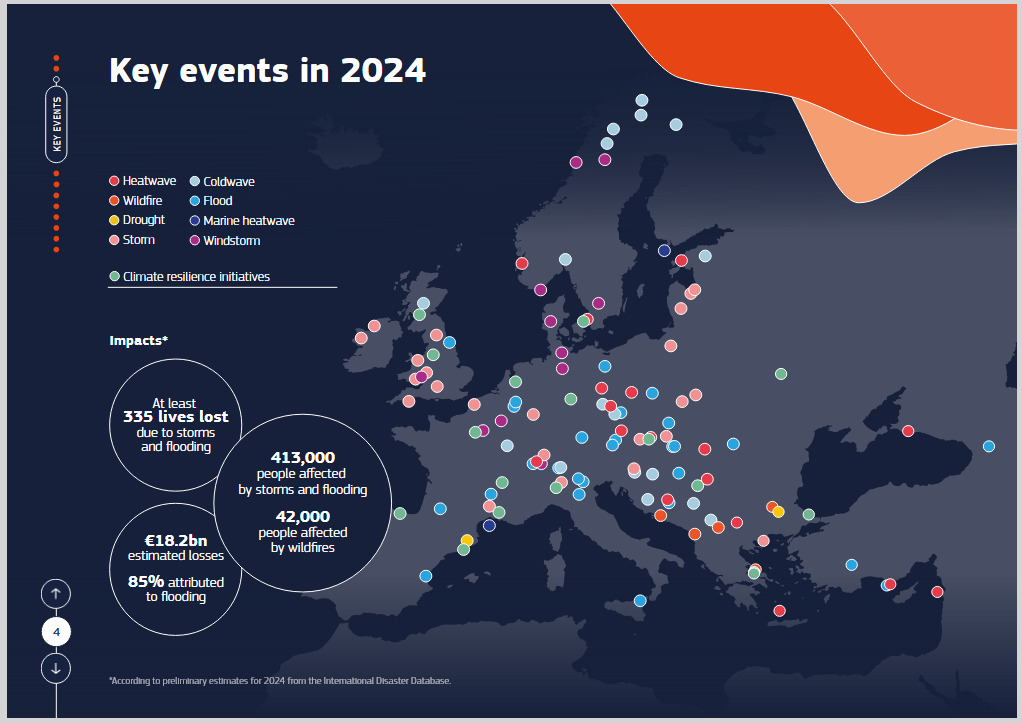
Flooding and wildfires. Flooding was the main problem

The map is a little hard to see. There may be more maps in the full report.

Generally, the heat was where the high level of precipitation was not.

Good mapping of disappearing glaciers.
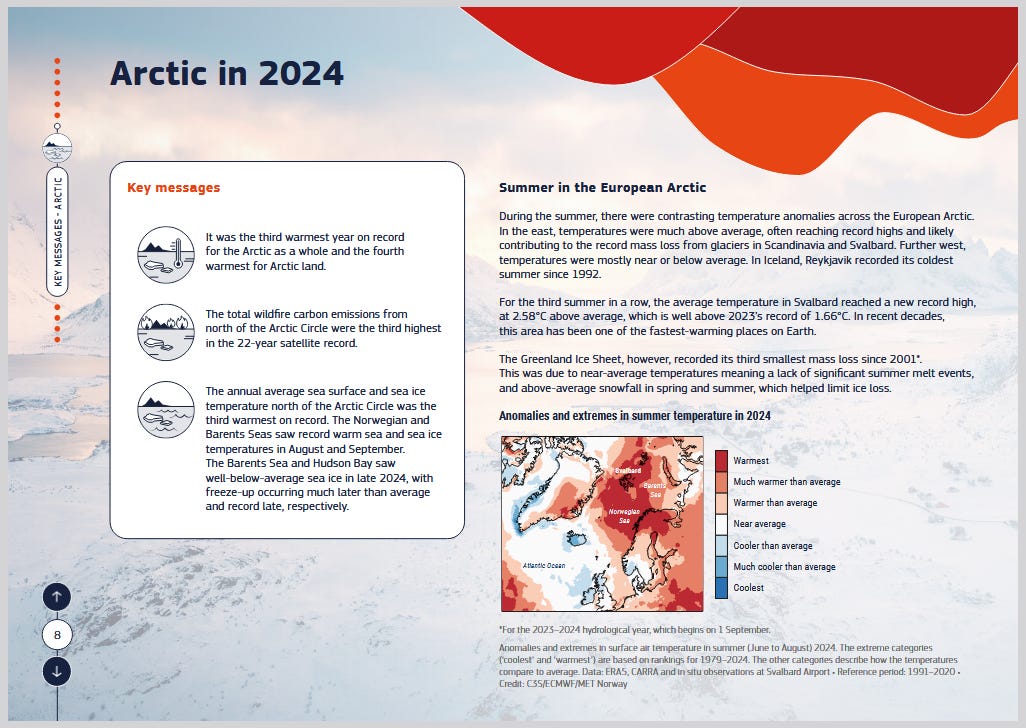
Part of the trend in the Arctic, but this provides good information for the European part of the Arctic and the North Atlantic. A lot of variability in a strong warming trend, but you can see areas that were cooler in 2024.

Attempts to be more resilient increased. I am not impressed.
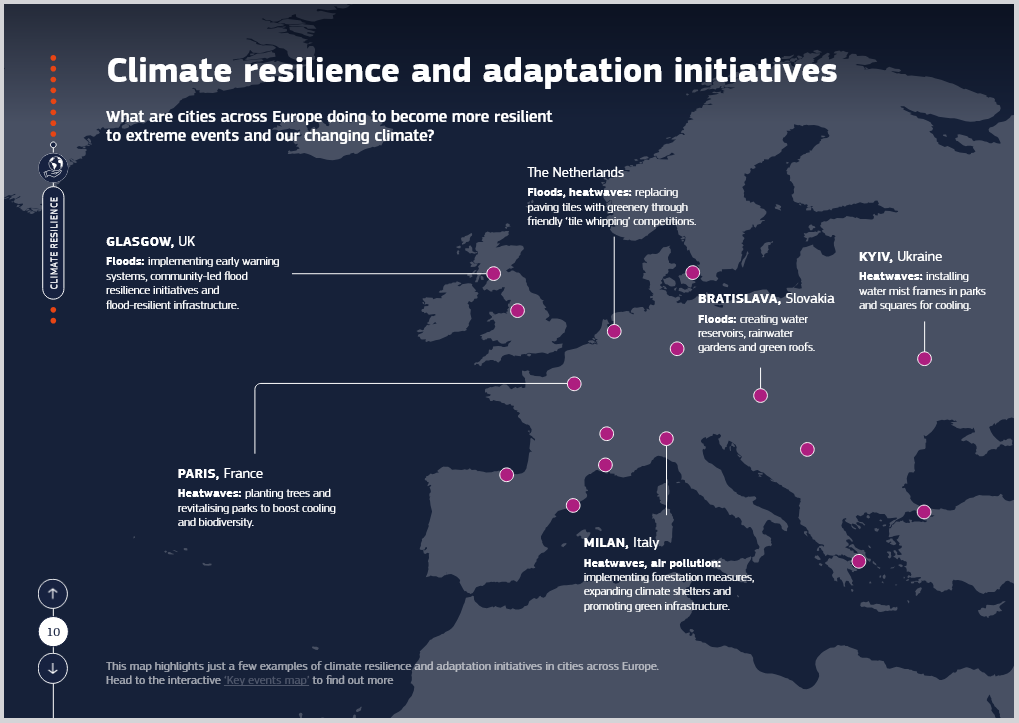
A little hard to read. One wonders if cities are where the effort needs to be. Many of the people impacted live in cities, but our food comes mostly from outside of cities, and the logistics network is outside of cities.
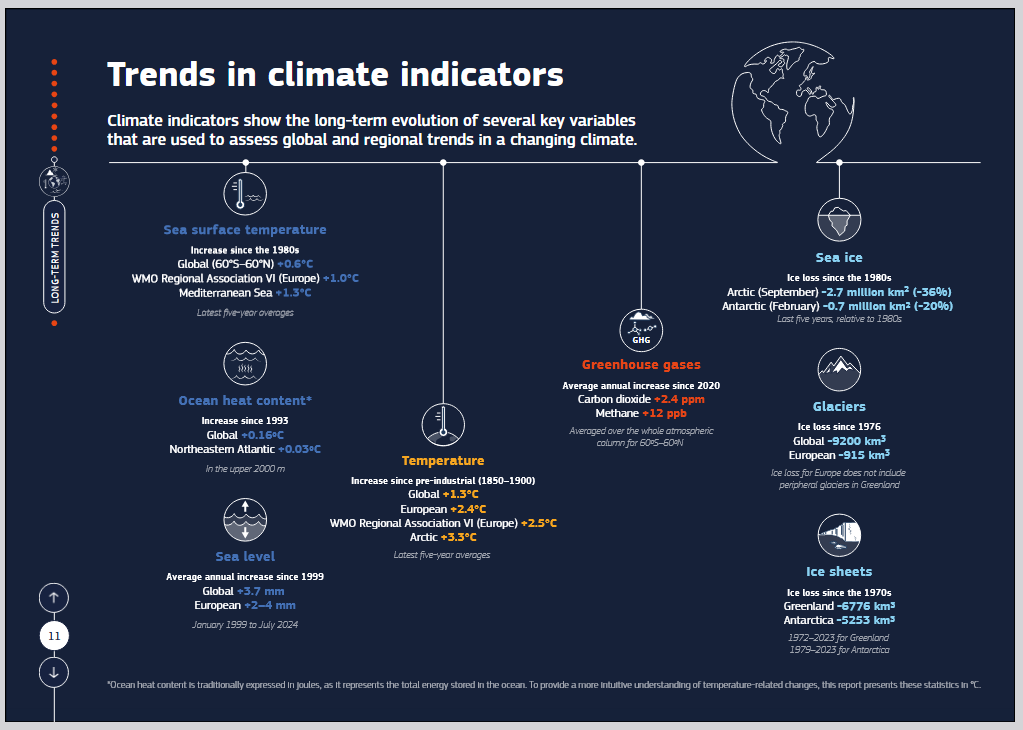
Again, I think they could make their graphics a bit easier to read. With my magnifying glass, I can read the numbers. I am sure the full report provides all of the numbers shown here, plus much more.


Useful Resources Include:
Climate at a Glance, which can be accessed HERE
NCEI Monthly Report, which can be accessed HERE
U.S. Ranking Maps can be accessed HERE.
Used one of these resources to plot the trend of European temperature and precipitation

It just keeps on getting warmer

Here you can see the downward trend in European precipitation, which reversed in 2024 as per this report by Copernicus and the World Meteorological Organization (WMO).
We certainly have to watch this.
I hope you found this article interesting and useful.


Sponsored Content:
This New Investment Could Pay You $7,013 Every Month
Wall Street insiders are already moving billions into this-before the window closes...
Take advantage of the biggest income opportunity of 2024 and 2025 now...
Click here to discover the NEW $7,013 per month income secret.
ref: 7512/2
This Time, Don’t Fall For It
Supply and Demand Don’t Drive Oil Prices
OPEC cuts production. International conflict blocks key shipping routes. A hurricane shuts down offshore rigs.
Conventional wisdom says prices should rise -- and keep climbing.
But does the evidence support this assumption?
Take Hurricane Katrina in 2005. It shut down 95% of Gulf oil production -- a quarter of total U.S. output.
So what happened to oil prices?
They fell over 20% in the three months that followed.
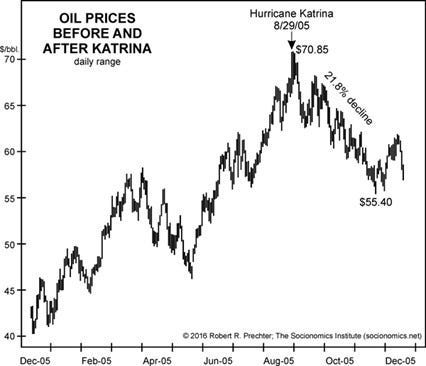
You can’t rely on supply and demand to forecast oil prices. That’s not how markets work.
Want to know what does drive oil prices?
In 2016, @elliottwaveintl’s Robert Prechter showed decades of market data that prove supply and demand do not regulate oil prices. More importantly, he revealed a method for forecasting oil with striking accuracy
Don’t miss this one. Viewers call it one of the best market presentations they’ve ever seen.

The EconCurrents is primarily a reader-supported publication. To receive new posts and support our work, please consider becoming a free or paid subscriber.

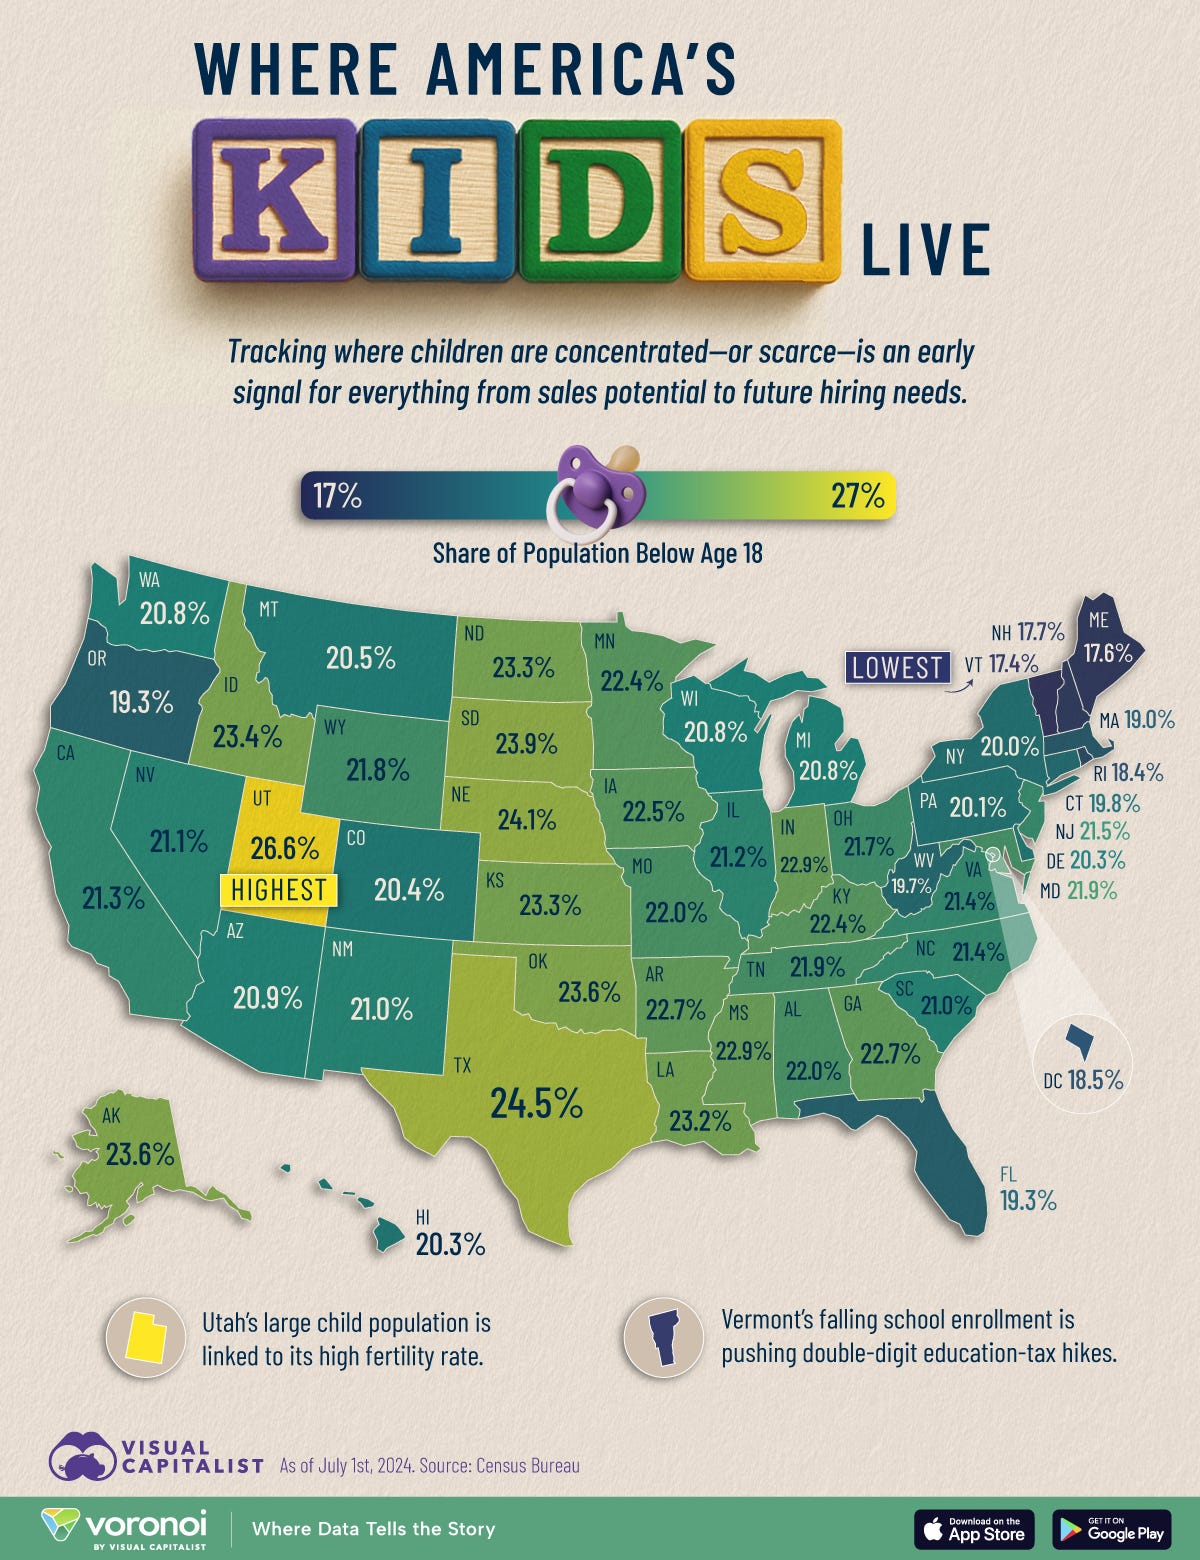
Infographic of the Day from Visual Capitalist:

Statista Graphic of the Day:

You will find more infographics at Statista

Other Articles We Are Reading:
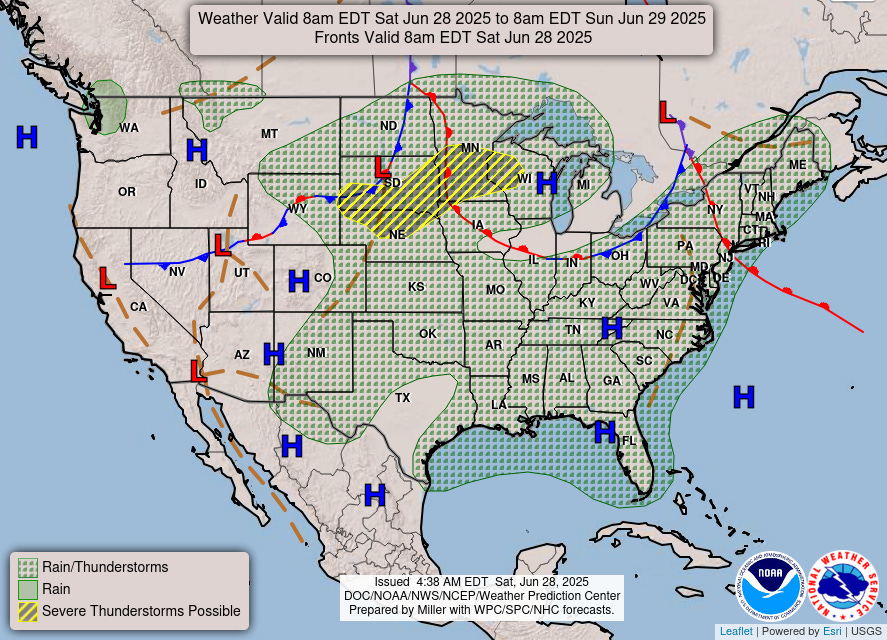
Weather Outlook for the United States and the World – Continuously Updated
This article focuses on what we are paying attention to in the next 48 to 72 hours. The article also includes weather maps for longer-term U.S. outlooks (up to four weeks) and three- and six-day World weather outlooks which can be very useful for travelers and understanding World News Events. We also provide continual coverage of world tropical events and special coverage for such events and other special weather situations impacting or likely to impact the United States. To get your local forecast plus active alerts and warnings click HERE and enter your city, state or zip code in the upper left corner.


States With High Median Ages May Not be as Uniformly Old as You Think
Many assume Florida is one of the nation’s oldest states and Utah to be among the youngest. But while a retirement magnet, not every corner of the Sunshine (or any other) state is “old” or, for that matter, “young.” Some older states like Florida have counties with much younger populations, while some counties within the youngest states like Utah are graying fast. In both instances, these intra-state discrepancies are driven by migration patterns combined with the numbers of births and deaths
Ten 10 Things to Know About the Property Market: June 2025
Amid the economic and political uncertainty, the housing market is benefiting from increased inventory and slower price growth, which could give potential homebuyers an advantage. However, buyers are still encountering high prices, which is deterring some from completing their purchase offers.
International Currency Dominance
We present a micro-founded monetary model of the world economy to study international currency competition. Our model features both “unipolar” equilibria, with a single dominant international currency, and “multipolar” equilibria, in which multiple currencies circulate internationally. Governments can compete to internationalize their currencies by offering attractive interest rates on their sovereign debt. A large economy has a natural advantage in ensuring its currency becomes dominant, but if it lacks the fiscal capacity to absorb the global demand for liquid assets, the multipolar equilibrium emerges.
Older Adults Outnumber Children in 11 States and Nearly Half of U.S. Counties
The U.S. population age 65 and older rose by 3.1% (to 61.2 million) while the population under age 18 decreased by 0.2% (to 73.1 million) from 2023 to 2024, according to the Vintage 2024 Population Estimates released today by the U.S. Census Bureau.
Economic Effects Everywhere All at Once
Global interconnectedness has been present for decades, as seen by how countries’ GDP growth and inflation tend to move together. While economists continue to analyze and quantify the sources of this comovement, cross-country linkages are clearly an important factor in driving economic fluctuations in each country.
Economic Sentiment and the Role of the Labor Market
An analysis looks at labor share, wages and price growth during recent economic expansions to understand U.S. consumer sentiment since COVID-19.
Labor Market Dynamics During the 2021–24 Inflation Surge
A new paper addresses the surge in the vacancy-to-unemployment ratio during the 2021–24 inflation episode. The increase in vacancies relative to unemployment was largely driven by falling real wages and a rise in job-to-job transitions, as workers sought to recover lost purchasing power
Financial Market Volatility in the Spring of 2025
In April 2025, U.S. financial markets experienced a sharp, temporary rise in volatility. How did that this level of volatility compare with the levels seen in other periods since 1990?
Is Demand or Supply More Important for Inflation?
Simulations using a Phillips curve-type relationship provide insights into the importance of demand versus supply for inflation over different periods. The decade of low inflation after the Great Recession was driven mainly by supply forces. Given that monetary policy operates to influence demand but not supply, this result helps to account for the persistent undershooting of the Fed’s 2% inflation goal during these years. In contrast, the period of high inflation during the pandemic era was driven mainly by demand forces.
The Penny Dilemma
As production of the penny ceases, what changes might occur to cash transactions between consumers and retailers? A new post focuses on an important issue known to economists as "optimal currency and coin denominations."
How Have Capital Levels of Futures Commission Merchants Changed Since the Global Financial Crisis?
Following the Global Financial Crisis of 2007–09 (GFC), regulators across the world enacted regulations to repair and strengthen financial markets. These regulations included a mandate to have more financial market contracts be cleared through central counterparties (CCPs), which are financial institutions that guarantee the performance of contracts. As a result, the central clearing of derivatives transactions increased significantly, and so did the allocation of capital to support this activity in line with regulatory requirements. If demand to centrally clear transactions continues to rise, will clearing firms have enough capital capacity to meet this new demand?
Reserves and Where to Find Them
Banks use central bank reserves for a multitude of purposes including making payments, managing intraday liquidity outflows, and meeting regulatory and internal liquidity requirements. Data on aggregate reserves for the U.S. banking system are readily accessible, but information on the holdings of individual banks is confidential. The authors summarize how non-confidential data can be used as a proxy to investigate questions about bank-level reserves.

Disclaimer
Nothing in this EconCurrents newsletter is financial, investment, legal, or any other type of professional advice. Anything provided in any newsletter is for informational purposes only and is not meant to be an endorsement of any type of activity or any particular market or product.