

Potentially Very Strong (top four) El Niño Coming as Per the NOAA Four-Season Outlook - April 18, 2026
Maybe the current chances of that are about 25 percent. Get your snow shovels while they are in stock.

This is a dynamic situation, so the strength estimates can change. Strength, as measured by the new Relative Niño 3.4 index, is not always correlated with impacts, and the impacts may vary across CONUS and the world. However, higher levels of the index suggest stronger impacts. With the warming of oceans, history is less of a guide. But the warming of oceans and the atmosphere means there is more moisture in the atmosphere. People tend to get confused, thinking that “Warming” means less precipitation. Warming means a thirstier atmosphere that sucks the moisture from the ground and possibly plants (and oceans). So it is a complex process.
Somehow I missed the ENSO Status Update Issued on April 9, 2026, so I show that at the end of this article, but focus initially on the new Four - Season Outlook, Mid-Month Outlook for May, and the Drought Outlook for the next three months.
On the third Thursday of each month, right on schedule, NOAA’s Climate Prediction Center (CPC) issued its updated Seasonal Outlook, which I describe as their Four-Season Outlook because it extends beyond one year into the future. The information released also included the Mid-month Outlook for the following month, as well as the weather and drought outlook for the next three months. I present the information issued by NOAA and try to add context to it.
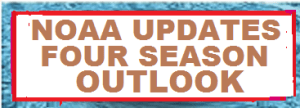
Let us take a look at the (mid-month Outlook) for May, 2026
It will be updated on the last day of April.
Notice for May, the area where the probability of being warmer than usual is quite large, with Washington and Oregon having the highest probability of being the states in the U.S. having the highest probability of being warmer than usual. Texas and Louisiana will be wetter than usual. The Northwest will be drier than usual.
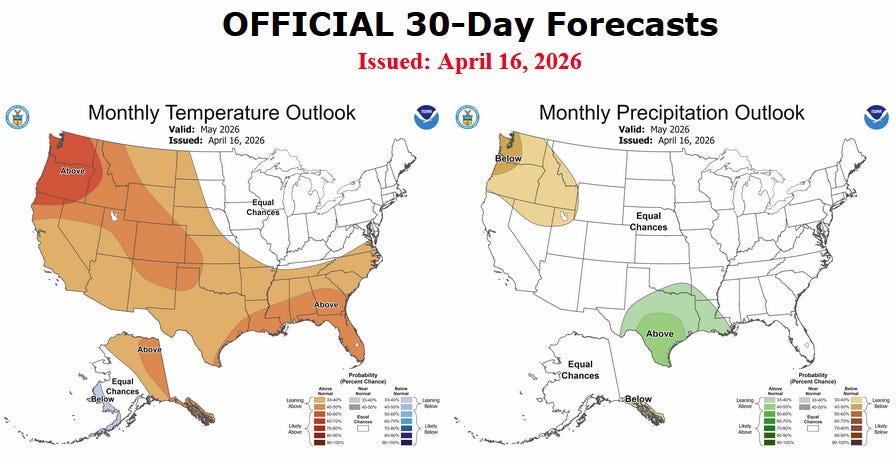
Now we look at a graphic showing the next month and the next three months.
The top row is what is now called the Mid-Month Outlook for next month, which will be updated at the end of this month. There is a temperature map and a precipitation map. The second row is a three-month outlook that includes next month. Usually, the Outlook maps are self-explanatory. What is important to remember is that they show deviations from the current definition of normal, which is the period 1991 through 2020. So this is not a forecast of the absolute value of temperature or precipitation, but the probabilities of a change from what is defined as normal, or to use the technical term, “climatology”.
Notice that the Outlook for next month and the three-month Outlook are fairly similar for temperature, but not for precipitation. This tells us that June and July, for most areas, will be similar to May in terms of deviation from Normal with respect to temperature but different with respect to precipitation.
The full NOAA Seasonal Outlook extends through May/June/July of 2027 (yes, that is more than a year out and into 2027 but the first nine months are more reliable than the tail end of this Outlook. The timing of the transition from El Niño back to ENSO Neutral is very unclear.
Large maps are provided for May and the three-month period May/June/July. Small maps are provided beyond that through May/June/July of 2027, with a link to get larger versions of these maps. NOAA provides a discussion to support the maps. It is included in the body of this article.
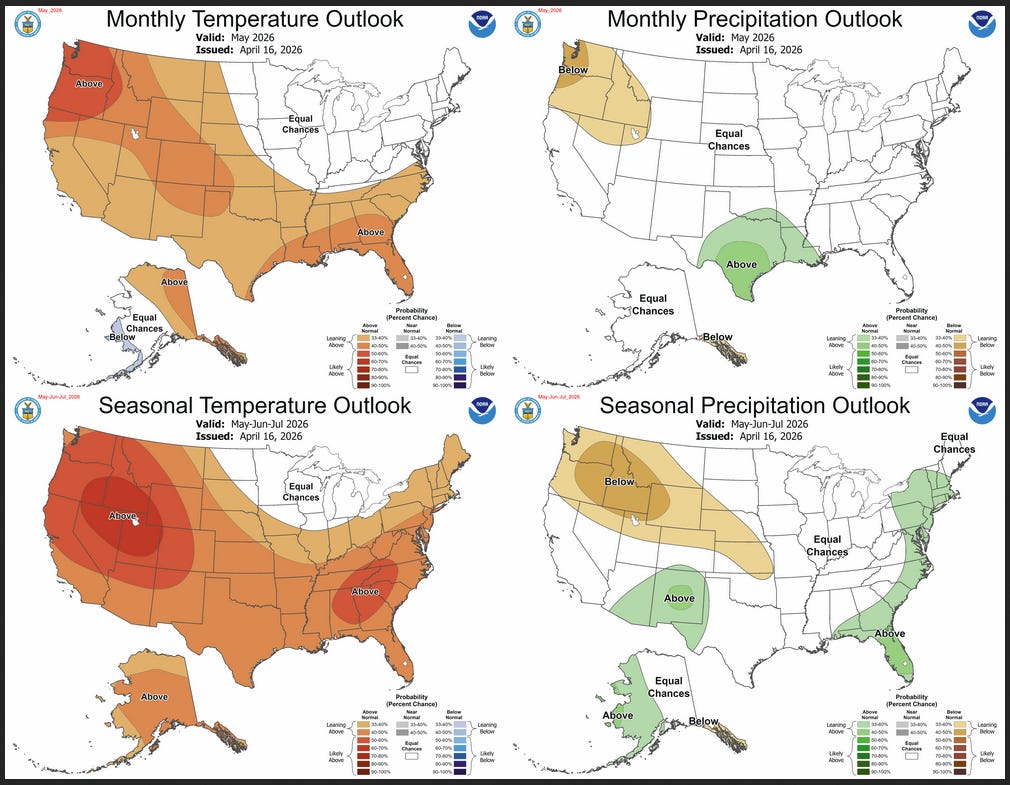
Here are larger versions of the temperature and precipitation Outlook maps for next month. Remember that these maps will be updated at the end of this month.


The maps are pretty clear in terms of the outlook.
Here are large versions of the three-month MJJ 2026 Outlooks. First temperature followed by precipitation. These maps are larger versions of what was shown earlier.


Looking Ahead.
Like I did last month, I included a precipitation graphic for next winter.

I was then, and I am now, surprised that the wetter than normal area only covers the extreme Southern Tier and the Mid-Atlantic Coast. In a way, “normal” for many Western States would be an improvement over recent years, but I was looking for above normal, and so far, that is not in the Outlook.
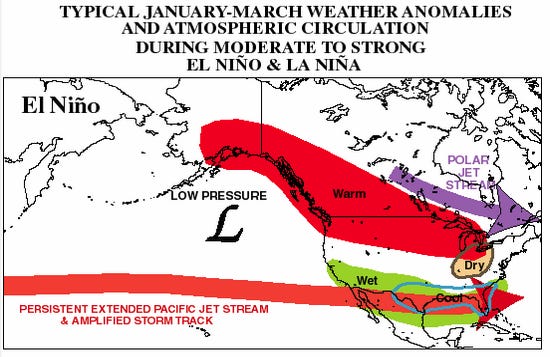
The above (LINK) is the typical El Niño pattern. So the actual Outlook is pretty close to the typical pattern. The simple way to look at it is that the Jet Stream tends to be further south for CONUS with El Niño. But El Niño is not the only factor that determines the weather. It is important and easier to forecast when thinking in terms of seasonal outlooks.
NOAA Discussion
Maps tell a story, but to really understand what is predicted to happen, you need to read the discussion. It is especially detailed and useful this month.
I combine the 30-day discussion with the long-term discussion and rearrange it a bit, and add a few additional titles (where they are not all caps, the titles are my additions). Combining the two discussions results in some redundancy, but I want to have the outlook for the coming month explained in detail.
I use bold type to highlight some especially important things. All section headings are in bold type; my comments, if any, are enclosed in brackets [ ].
Prognostic Discussion NWS Climate Prediction Center College Park MD 830 AM EDT Thu Apr 16 2026
CURRENT ATMOSPHERIC AND OCEANIC CONDITIONS
During March, ENSO-neutral conditions emerged, accompanied by near-average sea-surface temperatures (SSTs) in the central and east-central equatorial Pacific. During the May-Jun-Jul (MJJ) 2026 season, El Nino is likely to emerge (61 percent chance) and persist through at least the end of this year. The latest weekly Nino 3.4 index value is -0.3 deg C [Author’s Note: That is not La Nina but it shows a bias towards La Nina]. The equatorial subsurface temperature index (averaged from 180 to 100W) increased for the 5th consecutive month, with above-average subsurface temperatures extending across the entire Pacific to a depth of at least 250-300 meters. Westerly wind anomalies were observed over the western equatorial Pacific at low levels (850-hPa) and were evident over the eastern Pacific at high levels (200-hPa). Convection was near-average over the Date Line, with suppressed convection over western Indonesia. Collectively, the coupled ocean-atmosphere system reflected ENSO-neutral conditions.
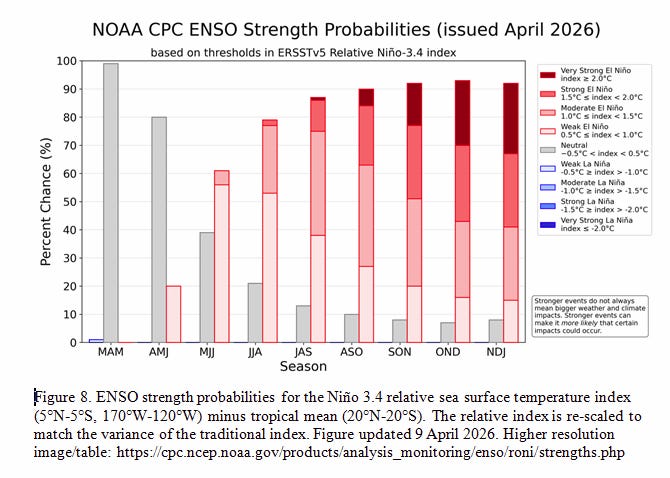
PROGNOSTIC DISCUSSION OF SST FORECASTS
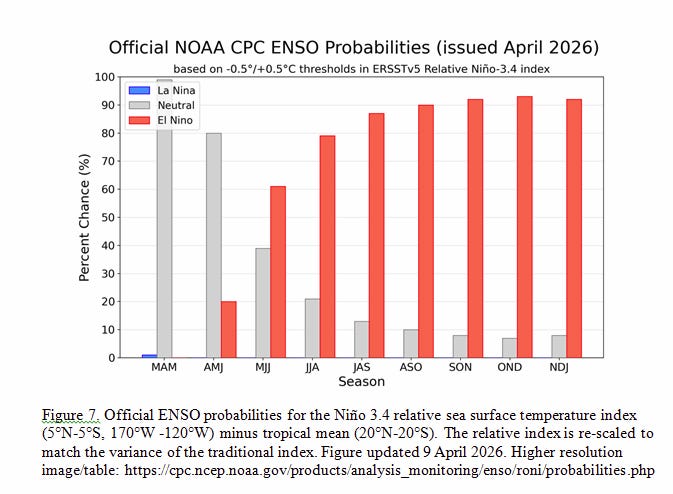
Nearly all SST anomaly forecasts for the Nino 3.4 region favor the development of an El Nino within the next few months, though there are significant differences regarding the predicted maximum intensity of such an event. The CPC SST Consolidation Nino 3.4 forecast reaches the threshold anomaly value of El Nino (+0.5 deg C) during the AMJ season, peaks at +1.2 deg C (a “moderate El Nino”) during OND 2026, and gradually tapers off after that, returning to ENSO-neutral by FMA 2027. The error bars associated with the consolidation become quite large by the onset of autumn 2026, so this also must be taken into account. The CFSv2 curve has the greatest slope of the Consolidation constituents, rapidly peaking near +2.1 deg C (a “very strong” El Nino) by OND 2026. The NMME and IMME/C3S ensemble averages pass through the El Nino threshold value of +0.5 deg C prior to May. CPC’s official ENSO Probabilities chart favors ENSO-neutral through the AMJ season (80 percent chance), with El Nino favored to become the dominant phase of ENSO during MJJ (61 percent chance). The odds for a warm event rapidly climb to near 90 percent by JAS and persist through at least NDJ 2026-27. CPC ENSO Strength Probabilities (issued in April 2026) depict odds near 50 percent that the RONI (Relative Oceanic Nino Index) will rise into either the strong (+1.5C <= RONI < +2.0C) or very strong (RONI >= +2.0C) categories during NDJ 2026. El Nino is likely because of increasing subsurface temperature anomalies across the entire near-equatorial Pacific, and recent westerly wind anomalies over the western Pacific that triggered oceanic Kelvin waves and downwelling. An important caveat with this outlook is the necessity of continued westerly wind anomalies across the equatorial Pacific Ocean during the Northern Hemisphere summer months, which is not assured.
30-DAY OUTLOOK DISCUSSION FOR MAY 2026
The May 2026 Temperature and Precipitation Outlooks are based on the: North American Multi-Model Ensemble (NMME) and International Multi-Model Ensemble (IMME), consolidation (combination of statistical and dynamical model tools), soil moisture influence and its constructed analog, and decadal trends . The Madden-Julian Oscillation (MJO) strengthened during early April and dynamical models have remained consistent since last week that a robust MJO propagates eastward from the West Pacific to the Indian Ocean during the latter half of April. This MJO evolution and its potential influence on the mid-latitude circulation pattern was considered in the temperature outlook. ENSO-neutral conditions are present with El Nino likely to emerge during May-June-July.
Temperature
The NMME and IMME support an increased chance of above-normal temperatures for the western contiguous U.S. (CONUS), much of the Great Plains, and Southeast. The largest above-normal temperature probabilities (greater than 50%) are forecast for the Pacific Northwest where the calibrated NMME and IMME have the strongest warm signal and there is also support from the statistical tools. In addition, the larger probabilities are consistent with the expectation for a drier-than-normal May. Recent heavy precipitation has moistened topsoil from eastern Oklahoma southward into central Texas. The GEFS and ECENS favor a continuation of the wet pattern for these areas with an expansion eastward into the Lower Mississippi Valley by the end of April. Due to the likelihood that topsoil is neutral to wet heading into May and tools favor above-normal precipitation for the month, above-normal temperature probabilities from the dynamical models are reduced across much of the south-central CONUS. Farther to the east, drier topsoil and the consolidation tool lead to an increased chance of above-normal temperatures for the Southeast. The current West Pacific MJO (phase 7) would favor an amplified 500-hPa trough developing over the eastern CONUS by the end of April which may result in a relatively cool start to May for the Midwest, Northeast, and Mid-Atlantic. However, if the MJO propagates back to the Indian Ocean, then above-normal temperatures could return to these areas later in May. Due to this expected variable temperature pattern during the month and a weaker warm signal among the dynamical models , equal chances (EC) of below, near, or above-normal temperatures are forecast from the Middle and Upper Mississippi Valley east to the Mid-Atlantic and Northeast. Elevated above-normal temperature probabilities are forecast for eastern Alaska. However, the outlook hedged colder across southwestern Alaska with EC forecast due to the Week 3-4 GEFS and ECENS favoring near to below normal early in the month. Large negative SST anomalies led to the outlook leaning slightly on the colder side along coastal southwestern Alaska and the Alaska Peninsula.
Precipitation
Based on the NMME, IMME, and consolidation, below-normal precipitation is favored for parts of southeastern Alaska, the Pacific Northwest, and the Great Basin. Conversely, these forecast tools support the outlook leaning on the wetter side across southwestern Arkansas, southeastern Oklahoma, central to eastern Texas, and most of Louisiana. Many of the dynamical models, especially the ECMWF, along with trends favor a wetter May across the Southeast. However, equal chances (EC) of below, near, or above-normal precipitation are forecast for this region as the wet model signal was offset by a correlation between dry April soil moisture and below-normal precipitation during May. As of mid-April, soil moisture is below the 5th percentile throughout the Southeast and will likely decline further during the next week with summerlike heat and an increasing water demand. A large coverage of EC is also forecast across a majority of Alaska and the lower 48 states due to high uncertainty at this time lead with a monthly precipitation outlook along with low predictability in forecasting anomalous convective precipitation throughout the central and eastern CONUS.
SUMMARY OF THE OUTLOOK FOR NON-TECHNICAL USERS (Focus on May, June and July)
Current oceanic and atmospheric observations reveal the transition from La Nina to ENSO-neutral is now complete. Another transition, this time from ENSO-Neutral to El Nino, is expected to occur during the May-Jun-Jul (MJJ) 2026 season (61 percent chance), with El Nino likely to persist through at least the end of 2026.
Temperature
The May-Jun-Jul (MJJ) 2026 temperature outlook favors above-normal seasonal mean temperatures for much of the contiguous U.S. (CONUS) with the exception of parts of the northern Plains, Upper Mississippi Valley, and Great Lakes region. A tilt toward above-normal temperatures is also forecast across Alaska. The highest probabilities (60-70 percent) of above- normal temperatures are forecast for areas of the northern and central Great Basin and Rockies.
Precipitation
The MJJ 2026 precipitation outlook depicts modestly enhanced probabilities of below-normal seasonal precipitation amounts from the Pacific Northwest and northern and central portions of the Intermountain West and Rockies southeastward across parts of the central Great Plains. Below-normal precipitation is also favored for most of Southeast Alaska. Above normal precipitation is favored for most of western Alaska, the vicinity of the Lower Four Corners region, and most of the Atlantic Coast states into the eastern Gulf region.
Equal chances (EC) are forecast for areas where probabilities for each category of seasonal mean temperatures and seasonal accumulated precipitation amounts are expected to be similar to climatological probabilities.
BASIS AND SUMMARY OF THE CURRENT LONG-LEAD OUTLOOKS
PROGNOSTIC TOOLS USED FOR U.S. TEMPERATURE AND PRECIPITATION OUTLOOKS
Physical subseasonal to seasonal (S2S) climate drivers considered in this set of outlooks include anomalous land surface states, in particular ongoing drought conditions as well as deficits in snowpack across the western CONUS. Correlations between current (April) soil moisture and MJJ temperature and precipitation were considered, as were ENSO composites and regressions. Though El Nino development is possible during JJA, actual impacts are more likely to arise by JAS. This also allows for the passage of the so-called Spring Predictability Barrier, a period of less-skillful SST anomaly forecasts. This “barrier” may be related to an annual reset or transition period of the global ocean-atmosphere system. El Nino composites and regressions are more likely to be reliable from JAS onwards through late autumn.
The NMME and Copernicus Climate Suite (C3S) dynamical model ensemble systems and their participant models are utilized as well as experimental output from a beta version of the Seasonal Forecast System (SFS, future system to replace the CFSv2). Standard statistical forecast tools, objective, skill weighted consolidation guidance, and long term temperature and precipitation trends contributed strongly to the outlooks at various leads and locations. In particular, the constructed analog anchored to SST (CA-SST) and a companion anchored to soil moisture anomalies (CAS) played a somewhat larger role than normal in this set of outlooks. The Calibrated, Bridging, and Merging (CBaM) tool was also used.
PROGNOSTIC DISCUSSION OF OUTLOOKS - MJJ 2026 TO MJJ 2027
TEMPERATURE
The MJJ 2026 temperature outlook favors above-normal seasonal mean temperatures for much of the CONUS, and all of Alaska, consistent with most model guidance. Maximum temperature probabilities of 60-70 percent are depicted over northern and central portions of the Intermountain West and Rockies. The elevated chances of above-normal temperatures over the West are supported by most of the available models and tools (including the SFS Beta), as well as trends . The widespread anomalous warmth correlates well with below-normal soil moisture, snow pack deficits, and natural analogs which are anchored on Pacific SSTs. The analogs use a nearest neighbor analysis and 12 months of SST observations, assigning equal weight to each of the four Nino regions. Over the interior Southeast, a secondary maximum for above-normal temperatures is favored (50-60 percent). The calibrated NMME, CBaM, CFSv2, ENSO-OCN and statistical and final consolidation tools support this secondary maximum, in addition to very low soil moisture profiles currently in place over that region. Elsewhere, from portions of the northern Great Plains eastward across the Upper Mississippi Valley and Great Lakes region, Equal Chances (EC) of above-, near-, and below-normal temperatures are favored. This broad region of favored EC is where many models and tools support very weak temperature signals or conflicting indications. It is also consistent with the idea of (favored) soon-to-emerge El Nino conditions, with non-warmth favored during the summer months.
During the next three seasons (JJA, JAS, and ASO) the signal for anomalous warmth over much of the CONUS remains dominant, especially over the western half of the Lower 48 states, Gulf Coast states, and East Coast states. Above-normal temperature chances are greatest over the West and the Northeast. This is backed by the CBaM and many of the other tools. With the expectation of a soon-to-develop El Nino, below-normal temperatures are slightly favored in JAS and ASO generally from the Middle Mississippi Valley into the central Great Lakes area. This cool preference is based largely on ENSO regression relationships. Temperature relationships with soil moisture were also consideredthrough these seasons. In Alaska, areas south of the Brooks Range are favored to be relatively warm, while the North Slope varies from different spatial coverages of above-normal temperatures to EC. Moving into the autumn months, the maps begin to assume the shape of familiar El Nino composites, with the southern CONUS transitioning from favored above-normal temperatures to widespread EC, while the northern CONUS retains the anomalous warmth. This pattern broadly persists throughout DJF 2026-27 and JFM 2027, the height of the winter season. El Nino also tilts the odds towards above-normal temperatures throughout Alaska during this period, with somewhat higher probabilities favored over southern sections of the state. Moving through late winter and early spring 2027, the official temperature outlooks begin to carve out a large area of EC across the north-central states, with a return to relatively warm temperatures over the southern CONUS, as favored by the ENSO-OCN tool and the statistical consolidation. Longer-term trends generally favor warmer-than-normal temperatures in Alaska during this period.
PRECIPITATION
The MJJ 2026 precipitation outlook modestly favors above-normal precipitation over most of the Atlantic Coast states, extending into the eastern Gulf Coast region. This has the support of CBaM, CFSv2, the final consolidation, C3S, NCAR_CCSM4, CMCC, and the 15-year OCN trend tool. Wetter-than-normal conditions are also favored in the Lower Four Corners region, with the expectation of a fairly robust monsoon. What precipitation falls in the month of July is forecast to carry the MJJ season as a whole, as May and June tend to be rather dry in the Desert Southwest. Below-normal precipitation is favored from the Pacific Northwest and northern Intermountain region east-southeastward across the northern and central Rockies, and the Central Plains. Approximately one-half of the available precipitation guidance leans towards this scenario, in addition to historical trends for this time of year (though trends do not favor the eastern extension of the relative dryness into the Central Plains). In Alaska, above-normal precipitation is favored for most of the western half of the state, with below-normal slightly favored over much of Southeast Alaska. This is consistent with most of the precipitation guidance. Elsewhere, which includes much of Eastern Alaska and much of the CONUS, EC is favored.
During the next two seasons (JJA and JAS), relative dryness is favored across parts of the far Northwest, the Central and Southern Plains, and (by JAS) Florida. For the Northwest, long-term trends favor relative dryness quite strongly, as do the statistical and final consolidation forecasts. These same tools favor below-normal precipitation over the Central and Southern Plains in JJA, in addition to the uncalibrated NMME, uncalibrated C3S, CFSv2, and the expectation of continuing drought. In ASO 2026, the C3S and OCN trend tool are primary supporters of the below-normal precipitation favored over the Northwest, and Central and Southern Plains. Areas of above-normal precipitation are favored throughout much of the Four Corners region during the JJA, JAS, and ASO seasons, in expectation of a fairly robust monsoon setup. Above-normal precipitation is also favored over the southern Mid-Atlantic and interior Southeast during these same seasons, well supported by the OCN trend tool. Another consideration towards the end of the summer is that tropical cyclone (TC) activity normally gets disrupted over the western Atlantic Ocean and Caribbean Sea by increased 200-hPa wind speeds associated with El Nino. This is why the area of favored above-normal precipitation has been nudged inland away from the Southeast coast. Moving into the autumn months, the precipitation outlooks begin to take on the familiar resemblance of El Nino composites. The canonical dichotomy of anomalous wetness across much of the southern tier of the CONUS and expanding areas of anomalous dryness across the northern tier become better established by late fall and winter. The two primary regions of favored dryness include the northwestern CONUS (with the signal becoming more concentrated inland across the Northwest by winter), and over the Great Lakes/Ohio Valley by the same period. By late winter, all that remains (in an anomalous sense) is a fairly small region of favored above-normal precipitation over the Southeast, which then varies in aerial extent during the remaining seasons of this outlook period.
In Alaska, above-normal precipitation amounts are favored over most areas south of the Brooks Range through the summer and autumn months. By DJF 2026-27 and JFM 2027, El Nino composites favor a thin sliver of relative wetness along the immediate southern coast of Alaska. EC is deemed the most likely precipitation outcome during FMA 2027, with historical trends favoring a return of above-normal precipitation chances to the North Slope and environs during the spring months.
Drought Outlook
NOAA also issues a Seasonal Drought Outlook, which is tied to the precipitation and temperature outlooks, plus the initial conditions. That means, among other things, that current soil conditions need to be considered when doing a drought forecast.

The yellow is the bad news, and it is a large area. And there is a very large area where drought is expected to persist. The area where drought is expected to improve is also large.
Short CPC Drought Discussion
Latest Seasonal Assessment - Extensive drought conditions continue across much of the nation, with over 60-percent of the contiguous United States currently experiencing drought conditions as of the April 7 US Drought Monitor. During the last month, widespread drought expansion and intensification occurred across the West, the central US, and the Southeast south of the Ohio River, as dry conditions and above-normal temperatures combined with increasing Spring evapotranspiration rates to rapidly dry soils and reduce streamflow levels. In contrast, several rounds of heavy precipitation eased drought across much of the Ohio Valley and Great Lakes region. A potent Kona Low brought flooding rainfall and eased drought conditions across Hawaii, while Alaska, Puerto Rico, and the US Virgin Islands remain drought free.
During the upcoming 3-month period, below-average precipitation favored for the Northwest combined with much below-normal mountain snow cover will likely lead to drought persistence and expansion. Poor snow conditions across the Sierras will also be a concern for California, which relies on recharge from snowmelt to maintain reservoir levels and adequate streamflow during the summer dry season. Across the Southwest, though the monsoon is favored to be robust, precipitation will likely be insufficient through the end of July to significantly impact the ongoing drought conditions. A greater chance for drought reductions exists across Texas and the lower Mississippi Valley, where storminess in the short term and a favorable monthly outlook may provide sufficient boosts in moisture. For the East, rapidly deteriorating drought conditions instead of an early spring recharge, which have resulted in dry soils, low streamflows, and continued longer term groundwater concerns preclude the potential for widespread drought reduction as evapotranspiration rates begin peaking in the summer, even though the seasonal precipitation outlook slightly favors above-normal precipitation. The best chance for drought reduction exists across Florida, where the rainy season is soon to begin, and along the immediate coastlines, where summertime seabreeze convection may help bring some drought relief.
Drought removal is favored for Hawaii’s Big Island, where anomalous southwesterly flow should provide additional chances for enhanced precipitation. Drought development is not anticipated across Alaska, Puerto Rico, or the US Virgin Islands, though dryness is favored across the Alaska Panhandle, and suppressed convection may overspread the Caribbean region, especially if conditions trend towards El Niño towards the end of the period.
Looking out at Four Seasons.
Twelve new Three-Month Temperature Maps.

Comparing the new Outlook with the prior Outlook.

A useful way of looking at this is to compare the new set of 12 overlapping three-month maps with the prior set issued last month.
The easiest way to do the comparison is to print out both maps. If you have a color printer, that is great, but it is not needed. What I do is number the images from last month, 1 - 12, starting with “1” and going left to right, and then dropping down one row. Then, for the new set of images, I number them 2 - 13. That is because one image from last month in the upper left is now discarded, and a new image on the lower right is added. Once you get used to it, it is not difficult. In theory, the changes are discussed in the NOAA discussion, but I usually find more changes. It is not necessarily important. I try to identify the changes, but I believe it would make this article overly long to enumerate them. The information is here for anyone who wishes to examine the changes.
I see some major changes as the El Niño has been factored in at least partially. As confidence increases, it will be factored into these maps to a larger extent.
Now the Twelve New Precipitation Maps

Comparing the new Outlook with the prior Outlook.

Similar to Temperature in terms of the organization of the twelve overlapping three-month outlooks. But there are major changes in the maps provided this month from what was provided last month, which did not factor in a possible El Niño.
As with temperature, another useful way of looking at this is to compare the new set of 12 overlapping three-month maps with the prior set.
A good approach for doing this comparison is provided in the temperature discussion.
The key piece of information used by NOAA follows.
This type of graphic does not show how strong the ENSO Phase is likely to be, but the probability of the three phases of ENSO. A strength probability analysis is shown in the next section of this article.
Resources
You can also find these maps individually on the CPC.NCEP Main Page. You can get to a lot of places from there, but to make it easy, here is the monthly discussion, and here is the long-term discussion, which includes the state of the Atmosphere. I have shown it in the text earlier in this article.
The image showing the Early Outlook for the subsequent month and the three-month outlook can be obtained by Clicking Here.
All of the three-month maps and the graphic that shows all twelve of them can be found here. It extends out for 12 overlapping three-month periods in addition to the most immediate three-month period. I like this graphic as you can see the forecast change in the pattern as the phases of ENSO come and go, plus factoring in the seasonal trends.
The link for the drought outlook map and some discussions that come with the map can be found by clicking HERE.
Other Reports and Information
The Wildfire Forecast can be accessed HERE
Now we present the report we should have provided last week

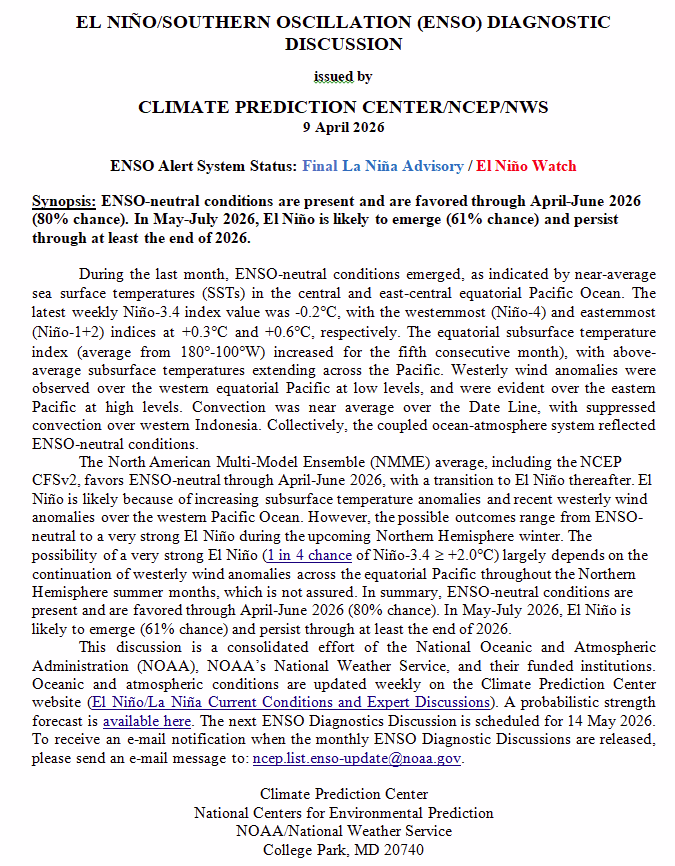
The second paragraph in the CPC discussion is what is important:
The North American Multi-Model Ensemble (NMME) average, including the NCEP CFSv2, favors ENSO-neutral through April-June 2026, with a transition to El Niño thereafter. El Niño is likely because of increasing subsurface temperature anomalies and recent westerly wind anomalies over the western Pacific Ocean. However, the possible outcomes range from ENSO-neutral to a very strong El Niño during the upcoming Northern Hemisphere winter. The possibility of a very strong El Niño (1 in 4 chance of Niño-3.4 ³ +2.0°C) largely depends on the continuation of westerly wind anomalies across the equatorial Pacific throughout the Northern Hemisphere summer months, which is not assured. In summary, ENSO-neutral conditions are present and are favored through April-June 2026 (80% chance). In May-July 2026, El Niño is likely to emerge (61% chance) and persist through at least the end of 2026.
Below is the middle paragraph from the discussion last month.
The North American Multi-Model Ensemble (NMME) average, including the NCEP CFSv2, points toward ENSO-neutral through the late Northern Hemisphere Spring 2026, with a transition to El Niño thereafter. Even though model forecasts are relatively less accurate this time of year, the increasing odds of El Niño are supported by the large amount of heat in the subsurface ocean and the expected weakening of the low-level trade winds. If El Niño forms, the potential strength remains very uncertain, with a 1-in-3 chance that it would be “strong” during October-December 2026 (Niño-3.4 ³ +1.5°C). In summary, a transition from La Niña to ENSO-neutral is expected in the next month, with ENSO-neutral favored through May-July 2026 (55% chance). In June-August 2026, El Niño is likely to emerge (62% chance) and persist through at least the end of 2026.
CPC Probability Distribution
Here are the new forecast probabilities:
Here is the forecast from last month.
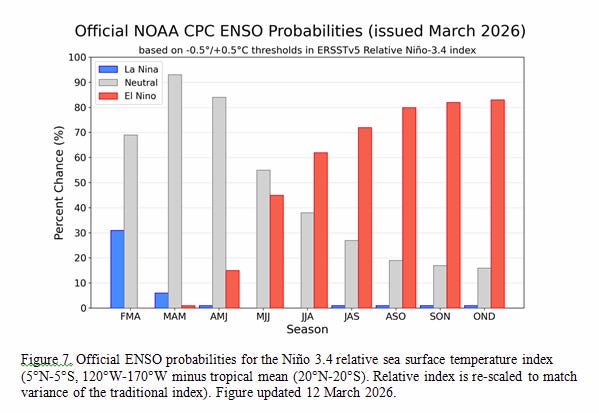
The probabilities are for three-month periods, e.g. MAM stands for March/April/May. It may not be scientific, but I pay attention to the middle month in these three-month probability assessments. analysis. Therefore, I conclude that June 2026 is likely to be when El Nino begins but it will get stronger in the following time periods.
Something New

Additional information we might want to look at.
There is much information we might want to look at, but these are a small number of graphics that I find especially useful, and I will limit what I include because of the length of the article.
This is a view from the surface down. ENSO (and the interaction with the atmosphere) is determined at the surface, but the subsurface is a clue to the future. We are mostly interested in 170W to 120W. You can see the anomalies at the surface, but these will soon be replaced by water from below for a number of reasons. Usually, the discussion is in terms of anomalies, i.e., changes from normal. But absolute values are also important. ENSO is defined in terms of sea surface temperature anomalies and the impact on the atmosphere.
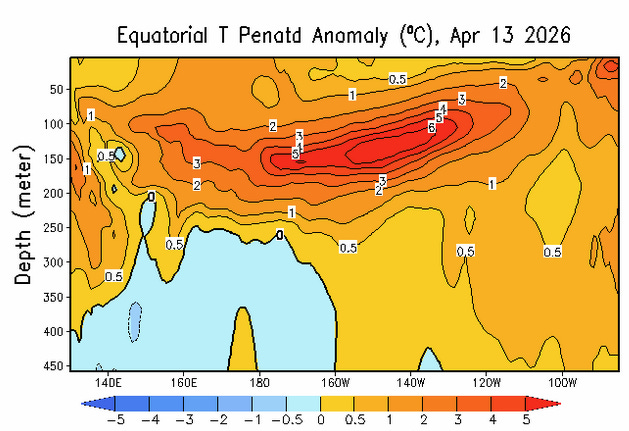
Below the surface, there is a lot of water that is anomalously warm and likely to reach the surface. To me, it looks limited in terms of more anomalously warm water to follow, and the area of the most anomalously warm water does not seem very large, so the period of time of the most intense part of the El Niño will probably not last for very long, which is the usual case. This is not likely to be a two-year El Niño.
Looking at Kelvin Waves
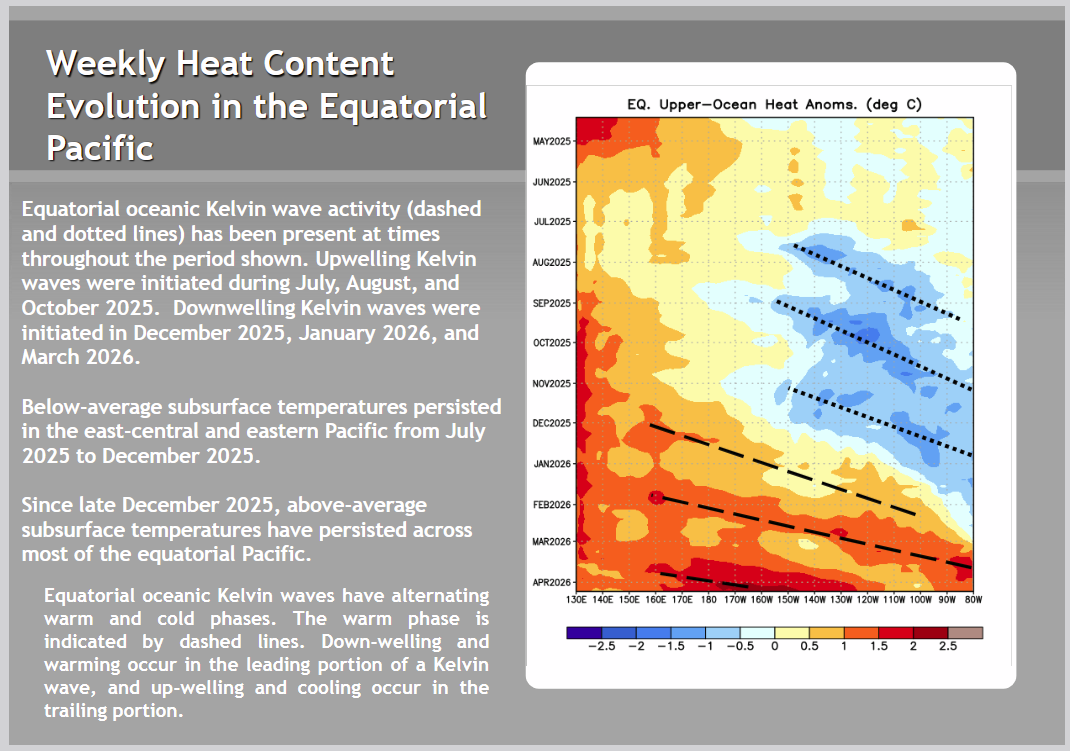
We see three downwelling Kelvin waves. The first one sort of petered out. The second moved us out of La Niña. The third has just started to influence the Niño 3.4 measurement area.
Some of the drivers of El Niño are downwelling Kelvin waves, warm water in the Indo-Pacific Warm pool, and the decline in the strength of the prevailing Easterlies along the Equator. I have no way of estimating the amount of warm water in the Indo-Pacific Warm Pool. NOAA does, and I think it is easy for them to do that.
I do not fully understand why the Easterlies weaken. It may have to do with the build-up from La Niña in the EndoPacific Warm Pool that changes the air pressure pattern around the world. I think that is the Bjerknes feedback loop (LINK).
That is why it is a cycle of sorts. Neither La Niña nor El Niño can sustain itself indefinitely.
But there are other factors involved, including the cold currents that move up along the west coast of South America and some currents that go both ways along the Equator, and the MJO can play a role.
If you read the NOAA discussion issued on April 16, you will see that basically all the models call for an El Niño, but they differ on timing, duration, and strength. We should have more clarity next month.
I hope you found this article interesting and useful