

How Do US Wages Affect Inflation?
Literature is reviewed and my current research is summarized for wages and inflation over the last 60 years.

For decades, wages have been considered a possible cause of consumer inflation. Research has also addressed how wages respond to inflation. Various researchers have described a process involving a wage-cost spiral.

Introduction
An IMF working paper (1) examined wage-cost spirals in various advanced economies dating back to the 1960s. They studied episodes in which accelerating consumer prices and rising nominal wages occurred for at least three out of four consecutive quarters. Only a small minority of such episodes were followed by sustained acceleration in wages and prices. Instead, inflation and nominal wage growth tended to stabilize, leaving real wage growth broadly unchanged. Mostly, they found inflation tended to lead to higher wages rather than higher wages pushing inflation. They summarized:
Wage-price spirals, at least defined as a sustained acceleration of prices and wages, are hard to find in the recent historical record. Of the 79 episodes identified with accelerating prices and wages going back to the 1960s, only a minority of them saw further acceleration after eight quarters. Moreover, sustained wage-price acceleration is even harder to find when looking at episodes similar to today, where real wages have significantly fallen. In those cases, nominal wages tended to catch-up to inflation to partially recover real wage losses, and growth rates tended to stabilize at a higher level than before the initial acceleration happened. Wage growth rates were eventually consistent with inflation and labor market tightness observed. This mechanism did not appear to lead to persistent acceleration dynamics that can be characterized as a wage-price spiral.
Wage-Push Inflation
Wage-push inflation and price-push inflation are two components of cost-push inflation. Mehra (2) studied wage growth inflation from 1952 to 1999. The measure of inflation used was the GDP Price Deflator. He also looked at the data for unit labor costs representing wage growth. Results with each wage growth metric were similar.
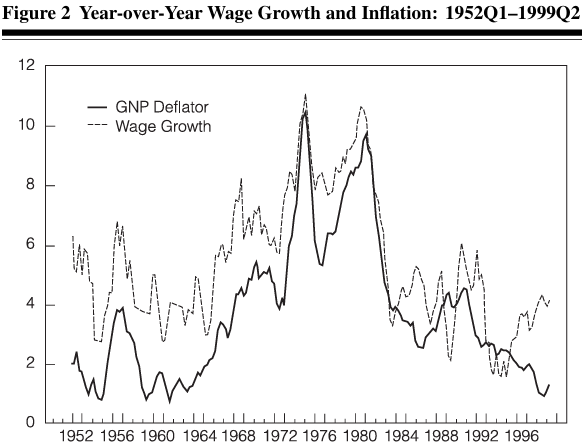
The analysis results indicate that wage levels help predict inflation over the full sample period. However, Mehta finds that results vary for different times:
Although wage growth does help predict inflation over the full sample period, this result is due to the high inflation subperiod 1966–1983. Wage growth does not help predict inflation during low inflation subperiods 1952–1965 and 1984–1999, suggesting wage growth has not been an independent source of inflation in the United States.
Wages, Prices, and Economic Activity
Knotek and Zaman (3) used cross-correlations (4) to attempt to extract meaningful wage/inflation association signals from noisy data sets. They included in their model levels of economic activity related to wages and inflation using the Phillips Curve. (5)
The data used in this study involved several metrics related to wages and inflation. They used annualized quarterly data. (Note: My research has found that this can introduce spurious noise correlations. These spurious factors are reduced by using year-over-year changes constructed from quarterly or monthly data.)
The results include the following:
Our measures have been moderately positively correlated since 1960: both price inflation and wage inflation tend to be above (or below) trend at the same time (figure 2). The strongest correlations have been between core PCE inflation and the ECI. The weakest correlations have been with the CPH measure, which is not surprising given its volatility. Depending on the measure, wages either lead core PCE inflation very slightly or are contemporaneous with it: the correlation peaks come in quarter t+1 or t.
And this:
Despite some of these empirical challenges, there are plenty of reasons to believe that connections between economic activity, wages, and prices do exist. The benchmark model for price inflation—the New Keynesian Phillips curve—posits that price inflation today is a function of expected future price inflation and the current marginal costs of production; by iterating forward, price inflation today depends on current and expected future marginal costs (Galí and Gertler 1999, Sbordone 2002). And marginal costs will generally depend on wages, especially in more labor-intensive industries.9 So even if price inflation may empirically appear to Granger-cause wages in some circumstances, current and expected future wages and other components of costs may actually be driving the inflation process in theory.1
In their conclusion, Knotek and Zaman say that their analysis finds that wages and prices tend to move together, complicating efforts to disentangle cause and effect. They conclude that wages offer limited forecasting power regarding future inflation and economic activity.
Uncertainty About the Direction of Causality
In 2017, Church and Akin (6) used a “vector error correction model” to examine the relationship between price transmission, labor compensation costs, and consumer and finished goods prices. They found that when inflation measures excluding food and energy are used, their results support that changes in consumer prices induce changes in wages. However, tests using indices that include food and energy are inconclusive on the direction of causality.
Recent Years
Several papers have found that the influence of wages on inflation has diminished in recent years. Kohlscheen and Moessner (7) estimate that
“…the short-run pass-through from domestic labour cost changes to core CPI inflation decreased from 0.25 in the 1980s to just 0.02 in the 2010s, while the long-run pass-through fell from 0.36 to 0.03.”
They attribute this to the “increased competition and contestability” brought on by globalization.
A paper by Kiley (8) used time-varying lags on wages and inflation:
Including wages in the information set in a multivariate unobserved components model delivers a substantial, but time-varying, weight on wages in the estimate of trend inflation. This finding differs from the limited role for wages in previous empirical work on price inflation—for example, highlighting the role that time variation in relationships may challenge traditional forecasting models.
The model includes 17 price and 13 wage measures, far more than other studies. Kiley states that his model does not indicate causality, but does conclude that wages inform estimates of trend inflation. He finds that the role of wages increased with the inflation shocks in inflation dynamics in the 2020s.
Del Negro et al (9) at the New York Fed used a DSGE (10) model to assess the sources of inflation in the most recent inflation spike (2020-22). They point out that their model does not attribute all notable movements in inflation to cost-push shocks by construction:
COVID-19 shocks have negligible effects on inflation, for two reasons. First, according to the model’s New Keynesian Phillips curve, inflation depends on the present discounted value (PDV) of future marginal costs, rather than on their current level alone. Transitory shocks to those marginal costs, even if large, have limited effect on their PDV. Second, the Phillips curve in the model is estimated to be very flat. Therefore, even large movements in the PDV of marginal costs have a small impact on inflation.
The Phillips Curve model's recent past bias and the assumption of an assumed present value for future marginal costs complicate the interpretation of the results. (This suggests that the model’s assumptions partly predetermine the modelling results.)
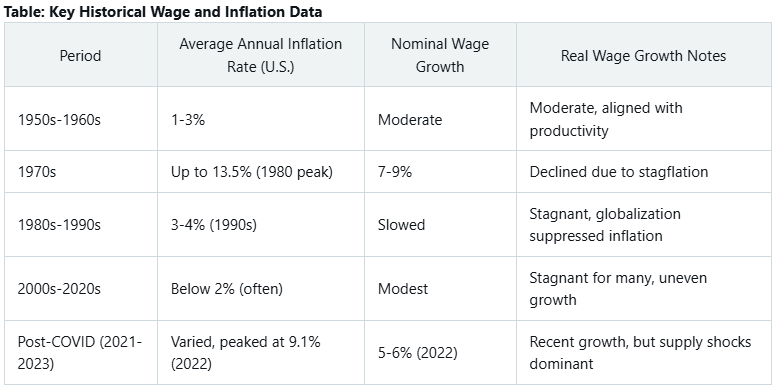
Summary of Wages and Inflation from 1950 to 2024
The following table summarizes wage and inflation data since 1950 and was generated by XAI, Grok3 Beta (11)
Objectives and Methods
Much of the research on the relationships between wages and inflation in the US has been directed toward searching for general functional descriptions of how inflation depends on wages. Efforts involved using models, such as those involving DSGE (9), cross-correlations (3), and the Phillips Curve (1,3,9). Despite providing some insight, the results have not completely satisfied the researchers. That has led me to look at historical data directly to attempt to gain an understanding without the use of models.
The approach I have used follows this reasoning:
The most significant concern should be the causes of surges in inflation. Thus, the factors most strongly associated with each surge should be identified. Feedback (spiral effects) should also be investigated during positive surges. This approach could be much more meaningful in understanding possible causes of inflation than looking for correlations across all intervals - positive inflation surges, negative inflation surges (disinflation/deflation), and intervals with minor inflation fluctuations.
Factors influencing disinflation and periods of lower inflation variation should be studied separately.
The correlation between possible causes of inflation and inflation itself can be studied individually. Interactions may exist, but these can be considered subsequently.
Correlation is a necessary but not sufficient condition for causation. If there is causation, there must be correlation, but correlation does not prove causation.
Offsetting data timelines can determine the direction of possible cause and effect. If A is a possible cause of B, then changes in A will correlate positively with changes in B that occur concurrently or later.
=================================================================
My Current Research Results
I have recently completed a study of relationships between US wages and consumer inflation. Wages were represented by the data series for Average Hourly Wages (AHW).(12) Inflation was represented by the Consumer Price Index (CPI).(13)
The monthly data series were selected:
For CPI, the data started on January 1, 1951;
For AHW, the data started on January 1, 1965.
Data Smoothing
The primary interest in this world is to determine how trends in AHW can be related to trends in CPI. Researchers referenced in the review have called these relationships “persistent.” Variations in the two metrics, month-to-month and quarter-to-quarter, contain transient plus persistent elements. We are interested in the persistent effects of one metric on the other. For this reason, we use year-over-year (YoY) changes in AHW and CPI to attempt to isolate persistent relationships.
However, using monthly data to calculate YoY changes still contains short-term volatility, illustrated in Figure 1.(14)
Figure 1. YoY Changes AHW with No Monthly Data Smoothing 1965-2025
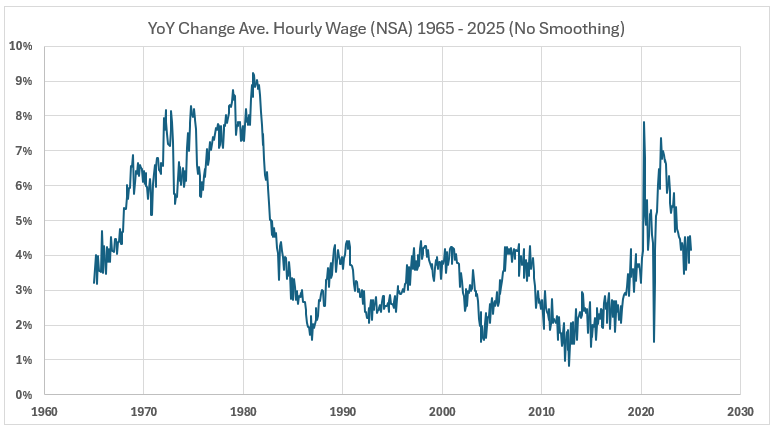
A much smoother result graph is obtained if the monthly data is subjected to smoothing(a 3-month moving average) before YoY changes are calculated. See Figure 2.
Figure 2. YoY Changes AHW with 3-Month Moving Average Data Smoothing 1965-2025
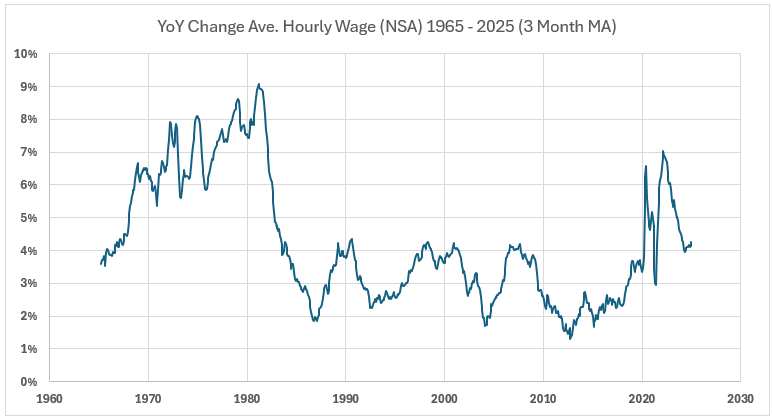
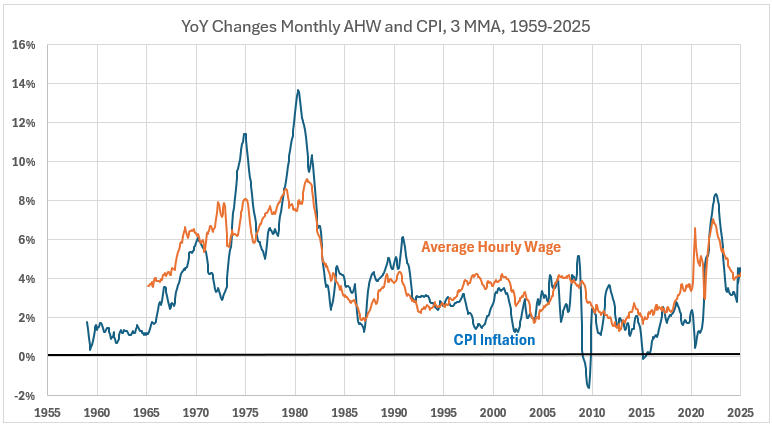
Figure 3 shows the 3-month moving average smoothed YoY plots for AHW and CPI. The CPI plot is noticeably smoother than the AHW plot.
Figure 3. Ave. Hourly Wage and CPI Monthly YoY Changes (3-Mo MA) — 1959 – 2025
Defining Periods of Inflation
Figure 4 shows the YoY changes in CPI plotted monthly using 3-month moving averages (3MMA) for the monthly CPI data.
Figure 4. Twelve-Month CPI Inflation Every Month, 1951 – 2024, Three-Month Moving Average Smoothing
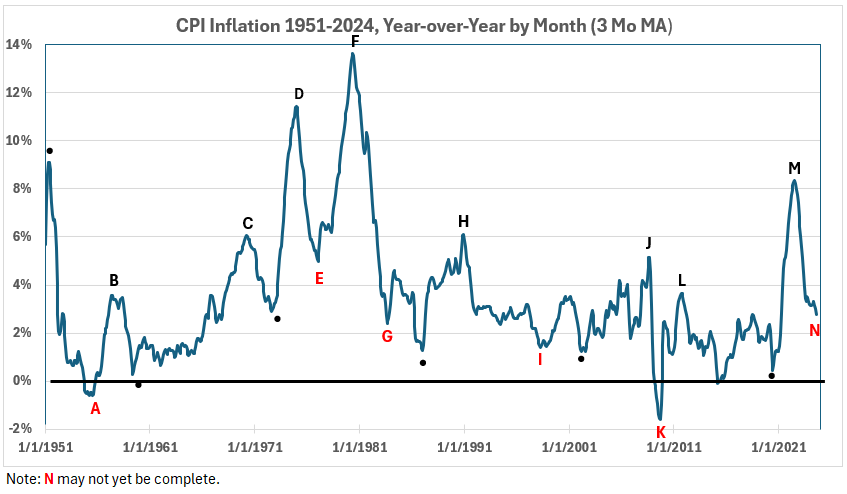
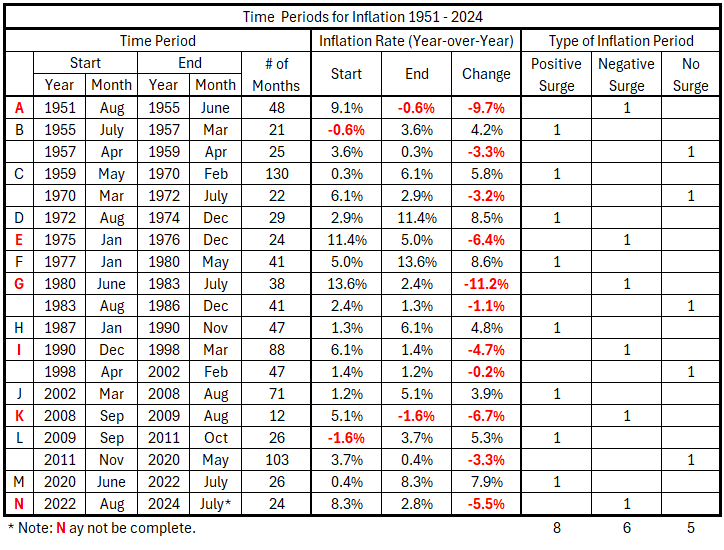
The data in Figure 4 is summarized in Table 1.
Table 1. Timeline of Monthly YoY Inflation Data 1951-2025
The construction of Figure 3 and Table 1 is based on the following definitions:
Positive Inflation Surges - Sequential years in which inflation increased by at least 4% without any countertrend pullback exceeding 1.5%. (8 periods - 32 years, 7 months).
Negative Inflation Surges - Sequential years in which inflation decreased by at least 4% without any countertrend pullback exceeding 1.5%. (6 periods - 19 years, 6 months).
The remaining years do not belong to a period with significant inflation changes (5 periods—19 years, 10 months).
Interesting note: All five periods with no significant inflation changes had small negative inflation changes (minor disinflation). This means that for the 72 years in Table 1, periods of inflation covered 32.583 years (45%) and disinflation covered 39.333 years (55%).
Causation
It is widely noted that correlation does not prove causation. This is correct, but it omits significant context—namely, that if causation exists, there must be correlation. The absence of correlation proves a negative, that there cannot be causation.
Stated succinctly, correlation is a necessary but not a sufficient condition for causation.
Another factor is also of great interest. If there is a correlation between A and B, is the possible causation direction A affecting B, or vice versa? A method to address this is to calculate correlations when the data for A is offset forward and backward with respect to B. If the data for A at time = t(0) correlates positively with the data for B at t(1), t(2), t(3), …, the direction of possible causation is A → B.
If the data for A at time = t(0) correlates positively with the data for B at t(-1), t(-2), t(-3), …, the direction of possible causation is B → A.
There can be no positive cause-and-effect if the correlations are negligible or negative.
However, negative correlation does offer the possibility that a positive change in a variable might cause an adverse change in another. For example, an increase in rainfall might correlate with decreased forest fires.
There is a priori evidence that there might be a possible cause-and-effect process between AHW and CPI. The scatter plot (Figure 5) for the data in Figure 3 shows R = 78% and R-squared = 61%.
Figure 5. Scatter Diagram for Monthly YoY Changes (3-Mo MA) for AHW vs. CPI (1965 – 2025)
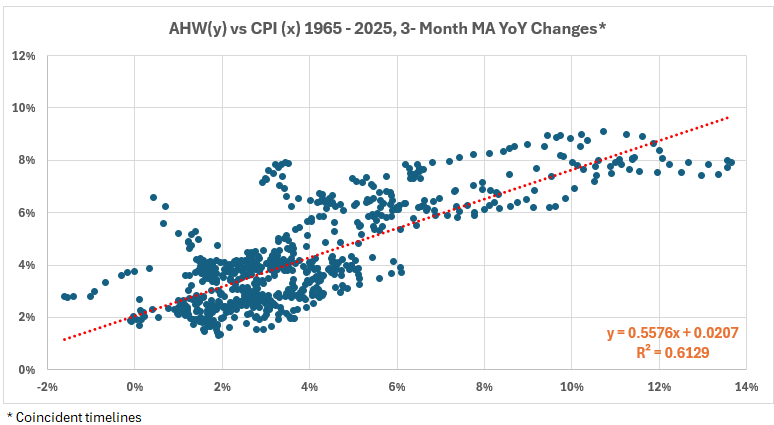
However, much more information may be available from this data than the overall generalization.
Relationships Between Wages and CPI During Eight Inflationary Surges
How changes in wages might affect inflation is of general interest. However, I submit that the most crucial question is whether wages might contribute to inflationary surges. Thus, I have examined the interaction between AHW and CPI during the eight inflationary surges. (15-21)
The analysis has been done using AHW as the dependent variable. It can also be done with CPI as the dependent variable, but the data treatment is a bit more complicated.
The relationship being tested is linear:
AHW = m(CPI) + b
This relationship is not influenced directly by any other possible factor affecting CPI.
The analysis involves determining AHW and CPI data correlations with 49 timeline offsets. Thus, there are 49 tables as follows:
AHW and CPI Inflation months are coincident.
AHW leads and lags CPI Inflation by one month (±1 month)
AHW leads and lags CPI Inflation by two months (±2 months)
…
AHW leads and lags CPI Inflation by two months (±24 months)
What We Want to Know
Every month, there are YoY changes in AHW and CPI. The question we pose is:
Are there any positive correlations between CPI during inflation surges and intervals of increasing YoY changes in AHW, coincidentally, or up to 24 months prior or subsequently?
In other words, when inflation surges, are there intervals where wages also increase faster than previously, and what are the correlations with leads and lags in the data?
Summary of Results
Table 2 summarizes the results for all instances where wage increases became larger during an inflation surge from 1965 to 2024. This table covers all he timeline offsets for AHW leading CPI. Boxes shaded in red are those with negative or weak correlation coefficients (R < 50%). When R = 50%, R-squared = 25%. That R-squared value means the maximum possible contribution of AHW increases to CPI inflation is 25%. Stated differently, 75% or more of increasing inflation is caused by something other than wage increases.
Table 2. Correlation between increasing changes in wage growth and inflation during CPI surges, when wage growth leads inflation
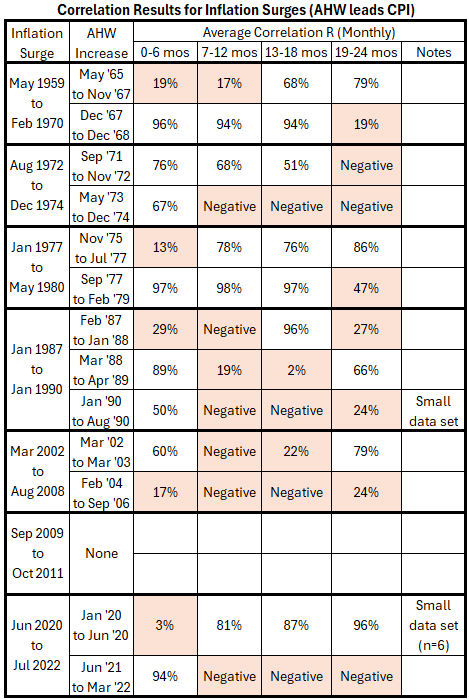
There are five patterns in the results of note:
There is a significant correlation in the first six months, but none after that during the first two years. This occurred three times, for the following increases in wage changes:
May 1973 to December 1974
January 1990 to August 1990
June 2021 to March 2022
If there is cause-and-effect here, it is transient.
There are two other occasions like the first one (above), except that a significant correlation was found again for the final six months. These were:
March 1988 to April 1989
March 2002 to March 2003
This may indicate the possibility of a transient effect being reinforced by a spiral feedback. The last six months’ number could also be spurious (coincidental).
There are three occasions where there are significant correlations for the first 18 months but not for the last six months. These were:
December 1967 to December 1968
September 1971 to November 1972
September 1977 to February 1797
This may indicate a more persistent effect.
There are four occasions where the first six months or the first 12 months have weak or negative correlations, followed by significant positive correlations. These are:
May 1965 to November 1967 (12 months not significant)
November 1975 to July 1977 (six months not significant)
February 1987 to January 1988 (12 months not significant)
January 2020 to June 2020 (six months not significant)
These may be examples of delayed response and nothing more.
There is one case where no significant correlation occurred between the two years (February 2004 to September 2006). This indicates that wages during this time could not have contributed significantly to inflation.
Table 3 covers the timeline offsets for CPI leading AHW.
Table 3. Correlation between increasing changes in wage growth and inflation during CPI surges, when wage growth lags inflation.
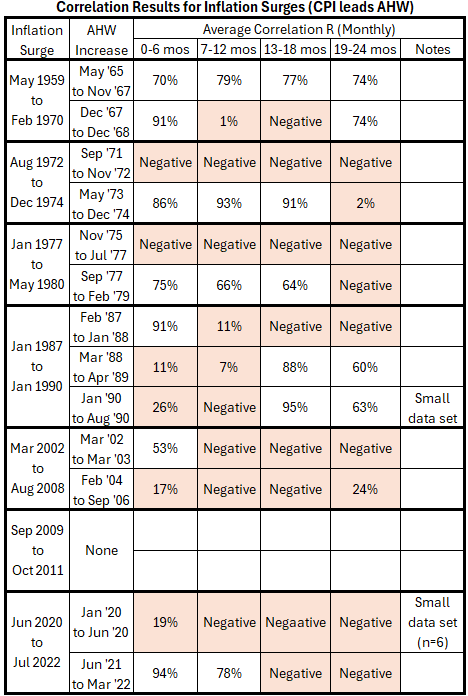
There are five patterns in the results of note:
In one case, all four boxes have significant correlations (May 1965 to November 1967). This indicates that there may have been an immediate and persistent cause-and-effect relationship for inflation pushing up wage increases.
In two cases, the persistence of inflation pushing up wage increases may have been less than 19 months, as the final box had a non-significant correlation. These cases were:
September 1971 to November 1972
September 1977 to February 1979
There are four cases where any effect of inflation, causing larger wage increases, was transient. These were:
December 1967 to December 1968 (The first six months are significant. The final six months were also significant, raising the possibility of a spiral feedback.)
February 1987 to January 1988 (The first six months are significant.)
March 2002 to March 2003 (The first six months are significant.)
June 2021 to July 2022 (The first 12 months are significant.)
There were two cases where significant correlations were delayed until 13 months and later. These were:
March 1988 to April 1989
January 1990 to August 1990
There were four cases where no significant correlations occurred within 24 months. These were:
September 1971 to November 1972
November 1975 to July 1977
February 2004 to September 2006
January 2020 to June 2020
Surging inflation in these four instances produced no corresponding wage increases within 24 months.
Conclusion
This work has shown why attempts to produce a predictive model for inflation by incorporating wage data have had limited success. Thirteen cases of wage increases becoming larger during inflation surges have shown many correlation patterns, including few or no significant correlations in some episodes. It was also seen that wage increases have not been sufficient in some cases to offset inflation within two years.
Footnotes
1. Alvarez, Jorge A; Bluedorn, John C; Hansen, Niels-Jakob H; Huang, Youyou; Pugacheva, Evgenia; Sollaci, Alexandre; Wage-Price Spirals: What is the Historical Evidence?, IMF Working Papers, November 11, 2022. https://www.imf.org/en/Publications/WP/Issues/2022/11/11/Wage-Price-Spirals-What-is-the-Historical-Evidence-525073.
2. Mehra, Kask P; Wage-Price Dynamics: Are They Consistent with Cost Push?, Federal Reserve Bank of Richmond, Quarterly Volume 86/3 Summer 2000. https://www.richmondfed.org/publications/research/economic_quarterly/2000/summer/mehra.
3. Knotek, Edward S II; Zaman, Saeed; On the Relationships between Wages, Prices, and Economic Activity, Federal Reserve Bank of Cleveland, Economic Commentary 2015-14. https://www.clevelandfed.org/publications/economic-commentary/2014/ec-201414-on-the-relationships-between-wages-prices-and-economic-activity.
4. Wikipedia, Cross-correlation. https://en.wikipedia.org/wiki/Cross-correlation.
5. Engemann, Kristie M; What Is the Phillips Curve (and Why Has It Flattened)?, Federal Reserve Bank of St Louis, Open Vault, January 14, 2020. https://www.stlouisfed.org/open-vault/2020/january/what-is-phillips-curve-why-flattened.
6. Church, Jonathan D; Akin Bradley; Examining price transmission across labor compensation costs, consumer prices, and finished-goods prices, Monthly Labor Review, U.S. Bureau of Labor Statistics, April 2017. https://doi.org/10.21916/mlr.2017.13
7. Kohlscheen, Emanuel; Moessner, Richhild; Globalisation and the Decoupling of Inflation from Domestic Labour Costs, arXiv, Cornell University, August 31, 2022. https://arxiv.org/abs/2208.14651.
8. Kiley, Michael T; The Role of Wages in Trend Inflation: Back to the 1980s?, Washington: Board of Governors of the Federal Reserve System, Finance and Economics Discussion Series 2023-022. https://doi.org/10.17016/FEDS.2023.022.
9. Del Negro, Marco; Gleich, Aidan; Goyal, Shlok; Johnson, Alissa; Tambalotti, Andrea; Drivers of Inflation: The New York Fed DSGE Model’s Perspective, Federal Reserve Bank of New York Liberty Street Economics, March 1, 2022, https://libertystreeteconomics.newyorkfed.org/2022/03/drivers-of-inflation-the-new-york-fed-dsge-models-perspective/.
10. Dynamic Stochastic General Equilibrium, Wikipedia. https://en.wikipedia.org/wiki/Dynamic_stochastic_general_equilibrium.
11. Grok 3 Beta, Grok 3 Beta — The Age of Reasoning Agents, XAI, February 19, 2025. https://x.ai/news/grok-3.
12. Federal Reserve Economic Data, Consumer Price Index for All Urban Consumers: All Items in U.S. City Average, Index 1982-1984=100, Monthly, Not Seasonally Adjusted. Data updated as of February 11, 2025. https://fred.stlouisfed.org/graph/?id=CPIAUCNS.
13. Federal Reserve Economic Data, Average Hourly Earnings of Production and Nonsupervisory Employees, Total Private, Not Seasonally Adjusted. Data downloaded February 7, 2025. https://fred.stlouisfed.org/series/CEU0500000008.
14. Lounsbury, John B, “Wages and Inflation. Year-Over-Year, Part 1.” EconCurrents, February 23, 2025. https://econcurrents.substack.com/p/sunday-newsletter-wages-and-inflation.
15. Lounsbury, John B, “Wages and Inflation. Year-Over-Year, Part 2.” EconCurrents, March 2, 2025. https://econcurrents.substack.com/publish/post/158211486.
16. Lounsbury, John B, “Wages and Inflation. Year-Over-Year, Part 3.” EconCurrents, March 9, 2025. https://econcurrents.substack.com/publish/post/158692331.
17. Lounsbury, John B, “Wages and Inflation. Year-Over-Year, Part 4.” EconCurrents, March 23, 2025. https://econcurrents.substack.com/publish/post/159662165.
18. Lounsbury, John B, “Wages and Inflation. Year-Over-Year, Part 5.” EconCurrents, April 6, 2025. https://econcurrents.substack.com/publish/post/160630993.
19. Lounsbury, John B, “Wages and Inflation. Year-Over-Year, Part 6.” EconCurrents, April 13, 2025. https://econcurrents.substack.com/publish/post/161075537.
20. Lounsbury, John B, “Wages and Inflation. Year-Over-Year, Part 7.” EconCurrents, April 27, 2025. https://econcurrents.substack.com/publish/post/162923480.
21. Lounsbury, John B, “Wages and Inflation. Year-Over-Year, Part 8.” EconCurrents, May 4, 2025. https://econcurrents.substack.com/publish/post/162923480.