

December 2025 Economic Forecast: Data Indicates A Weak Consumer. Health Care Is Sinking the Economy.


EconCurrents‘ Economic Index fell again this month, with the aftereffects of the government shutdown being the primary cause. The U.S. economy was not strong before the shutdown. Note that generally hard data for October 2025 is yet to be released due to the government shutdown - so it is hard to put our forecast into context. Read on to understand the currents affecting our economic growth.


Overview of this Economic Forecast
This post will summarize the:
the government shutdown & inflation
special indicators,
leading indicators,
predictive portions of coincident indicators,
review of the technical recession indicators, and
interpretation of our index – EconCurrents Economic Index (EEI) – which is built of mostly non-monetary “things” that are indicative of the direction of the Main Street economy at least 30 days in advance.
The Government Shutdown
The U.S. federal government experienced its longest shutdown in history from October 1, 2025, to November 12, 2025—a total of 43 days. This occurred due to congressional gridlock over appropriations for fiscal year 2026, with Senate Democrats blocking Republican-backed funding bills that lacked extensions for Affordable Care Act subsidies and other health programs. The shutdown furloughed hundreds of thousands of federal employees, halted non-essential services, and disrupted programs like SNAP (food assistance) and Head Start (early education). Congress passed a continuing resolution on November 12, signed by President Trump, extending funding through January 30, 2026, with back pay guaranteed for affected workers.
The 2025 government shutdown centered on partisan disagreements over federal appropriations, including whether to extend enhanced Affordable Care Act (ACA) premium tax credits (introduced in the 2021 American Rescue Plan Act and extended through 2025 via the 2022 Inflation Reduction Act). These subsidies, which expanded eligibility beyond 400% of the federal poverty level (FPL) and capped household contributions at lower percentages of income, were not extended in the continuing resolution (H.R. 5371) that ended the shutdown. Their expiration at the end of 2025 reverts subsidies to pre-2021 levels starting January 1, 2026, saving the federal government significant outlays but increasing premiums for ~22 million enrollees (92% of ACA marketplace participants).
“Other health programs” referenced in shutdown negotiations included extensions for community health centers, the National Health Service Corps (loan repayment for primary care providers in underserved areas), Teaching Health Center Graduate Medical Education, the Special Diabetes Program, and telehealth flexibilities under Medicare. The continuing resolution extended these only through January 30, 2026, creating a short-term lapse risk but no long-term savings commitment during the shutdown itself. The primary fiscal “savings” tied to the shutdown resolution thus stem from the ACA subsidies’ non-extension, with ancillary impacts from delayed health program funding.
The shutdown’s total economic impact is estimated in the tens of billions of dollars, primarily from lost productivity, reduced federal spending, and decreased private-sector demand. Most losses were temporary (e.g., deferred wages and services), but some were permanent due to irrecoverable output. Here’s a breakdown based on analyses from the Congressional Budget Office (CBO), the White House, and other sources:
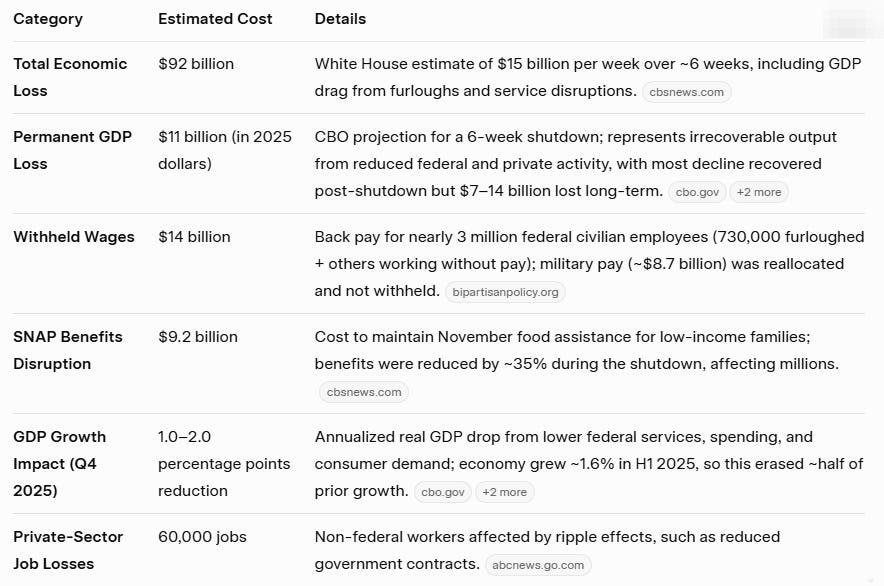
The cost of the shutdown could have been worse. The Congressional Budget Office (CBO) and other nonpartisan analyses have estimated the federal budget savings of not extending the enhanced ACA subsidies. Savings accrue from reduced federal spending on premium tax credits, though offset by indirect costs like higher uncompensated care (e.g., emergency room visits by the newly uninsured) and potential premium hikes for all plans due to a sicker risk pool. For FY2026 specifically (the immediate post-shutdown year), savings are prorated from multi-year projections.
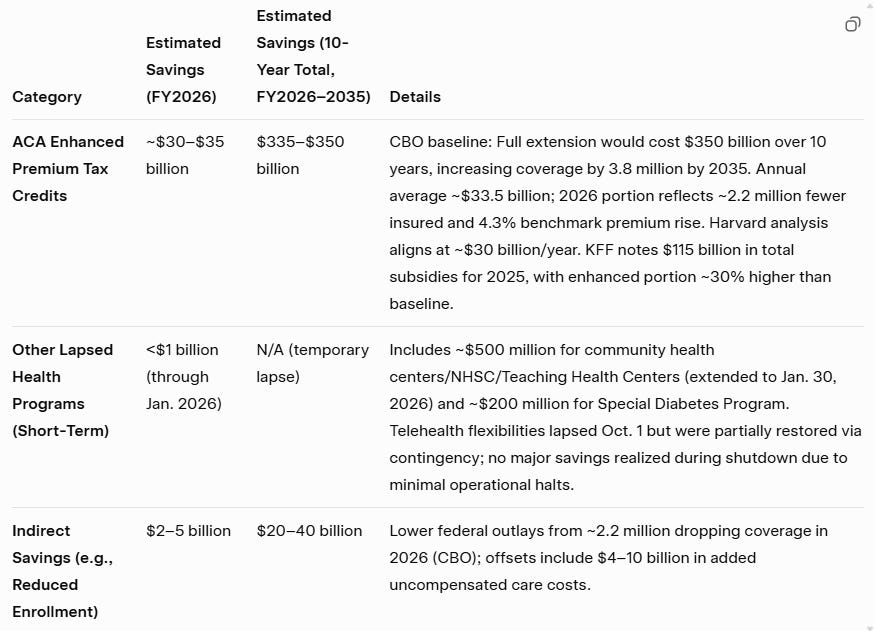
In broader context, the decision not to extend the enhanced ACA subsidies carried significant tradeoffs. According to the Congressional Budget Office, approximately 2.2 million people are projected to lose health insurance coverage in 2026, with that number climbing to an average of 3.8 million people per year through 2034. For those who remain enrolled and receive subsidies, the average annual premium is expected to more than double, rising from $888 in 2025 to $1,904 in 2026, and roughly one in ten current subsidy recipients will lose eligibility entirely when the income cap reverts to 400% of the federal poverty level.
Republicans presented the non-extension of the ACA as an act of fiscal discipline, particularly in light of the $92 billion economic cost of the prolonged government shutdown, which was driven largely by furloughs and disruptions to programs such as SNAP. President Trump suggested that the resulting budgetary savings could be redirected toward direct payments to consumers or expanded contributions to health savings accounts and flexible spending accounts, but no such reallocation was included in the final continuing resolution.
Unlike the ACA subsidies, the other health-related programs at issue—such as funding for community health centers, the National Health Service Corps, the Special Diabetes Program, and certain Medicare telehealth flexibilities—were not central to the shutdown standoff and experienced only brief lapses before being extended through January 30, 2026. A full-year non-extension of those smaller programs could have generated roughly $2–3 billion in annual savings, but the agreement kicked the decision down the road. Over the longer term, the CBO projects that the expiration of the enhanced subsidies will cause gross benchmark premiums to rise an average of 7.9% from 2026 through 2034, partially offsetting the federal savings by increasing the underlying cost of the remaining subsidized coverage.
The Government cannot keep spending money by borrowing money that our children and grandchildren will have to pay back. Our children and grandchildren will not benefit at all from their servicing this debt. The vulnerable population needs protection, but the solution is not to spend borrowed money. The challenge is finding sustainable funding mechanisms—perhaps through efficiency reforms or broader tax bases—that don’t exacerbate debt.
ACA did little to reduce the overall health care costs in the US, and simply put the costs in a blender. ACA simply created a different set of beneficiaries and payors, and certainly didn’t solve the underlying drivers of high spending.
Health care is sinking the U.S. economy. It’s undeniably a major strain. Nearly 18% of GDP in 2025—far higher than the OECD average of 9%. Compare this to U.S. defense spending, which is projected to be about 2.9% of GDP in 2025.
Health care consumes resources that could go elsewhere, contributing to slower growth and higher deficits. Administrative costs alone account for about 22% of spending ($1 trillion annually), highlighting inefficiencies like billing complexity and lack of price transparency. Premium hikes in 2025 (up to 59% for some ACA plans post-subsidy expiration) underscore ongoing affordability issues. Solutions might involve market reforms, value-based care, or international benchmarking to curb prices without borrowing more.
I hope Congress can come up with some practical solutions that do not include handing this debt to my children or grandchildren.
Overall Inflation:
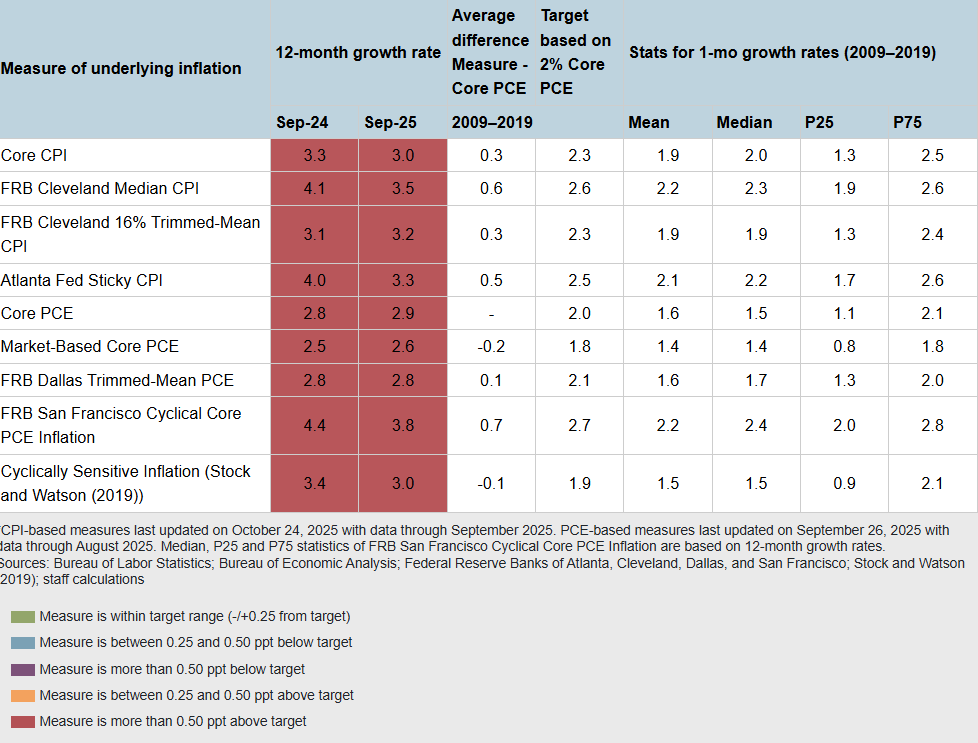
EconCurrents follows the Federal Reserve Bank of Atlanta’s Underlying Inflation Dashboard, which uses data from the US Bureau of Economic Analysis, the Federal Reserve Bank of San Francisco, and the Federal Reserve Bank of Dallas. Inflation has modestly declined earlier this year, but interestingly, the downward movement in some of the measures of inflation released since September 2024 was matched by the upward movement of others. Inflationary pressures remain high, and inflation continues to impact any economic forecast.
As a side note, interest payments on the national debt is now beginning to take up a sizeable chunk of the federal budget due to the rising debt and interest rates. Unfortunately, the graph below is updated only quarterly – and is now complete through 2Q2025. It does show that in 2Q2025, 15.4% of federal expenditure went to interest payments on debt (down from 15.5% the previous quarter). It is not a major deal yet, but it could be if it starts approaching the previous high of 23.5% in 1Q1991. The rate of increase for interest has recently moderated.
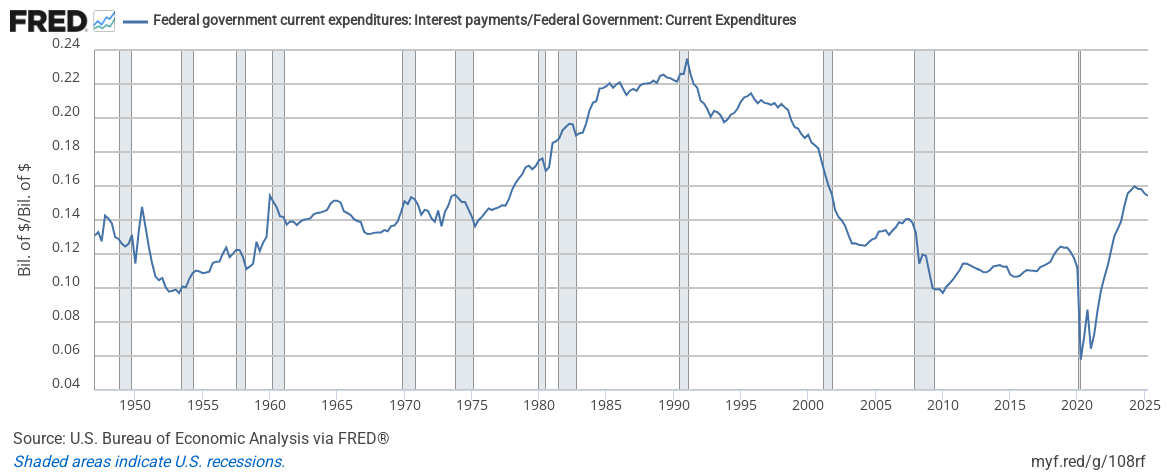
If the above graph does not appear, [click here] to view
