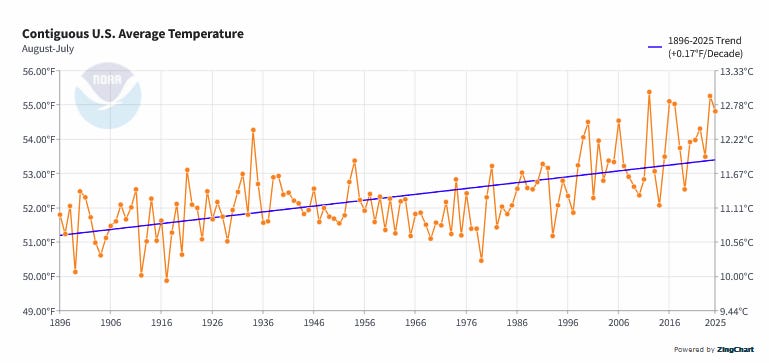
It is getting warmer in the Contiguous United States, which we call CONUS for short. This leaves out Alaska and Hawaii, but Alaska is getting warmer at an even more rapid rate.
What does this mean? It means a lot of things:
A. It costs less to heat a house and more to keep it cool
B. Periods of extreme heat are more frequent and problematic.
C. It is harder to store water and transport water by rivers and canals
D. The potential for dry farming is decreasing. Irrigation is increasingly important, and over time, growing in controlled environments will become more prevalent (a future article). Some crops can not handle heat even if well watered. Others love the heat. The amount of water a crop needs relative to temperature is very complex and generally not well understood.
E. Since forests are generally not irrigated, heat can increase the risk of wildfires. Wildfires leave burn scars, which enhance flooding when it does rain. Wildfires increase property insurance rates.
F. Weather events may become more extreme. Except in certain areas, we are not going to have less precipitation. But everywhere there will be more evaporation (formula) at the end of the article.
This article is focused mostly on the recent and current extreme events in the U.S. It does not address the longer-term problem of a hotter Earth.
I am presenting mostly the information that I have been receiving on the current heat crisis. I have not commented on that information until the end, where I have added some additional information. The information provided by NOAA is well explained. Towards the end, I have a short but important report from NASA.
So it is mostly a news report. I have tried to include links so readers can update the graphics.
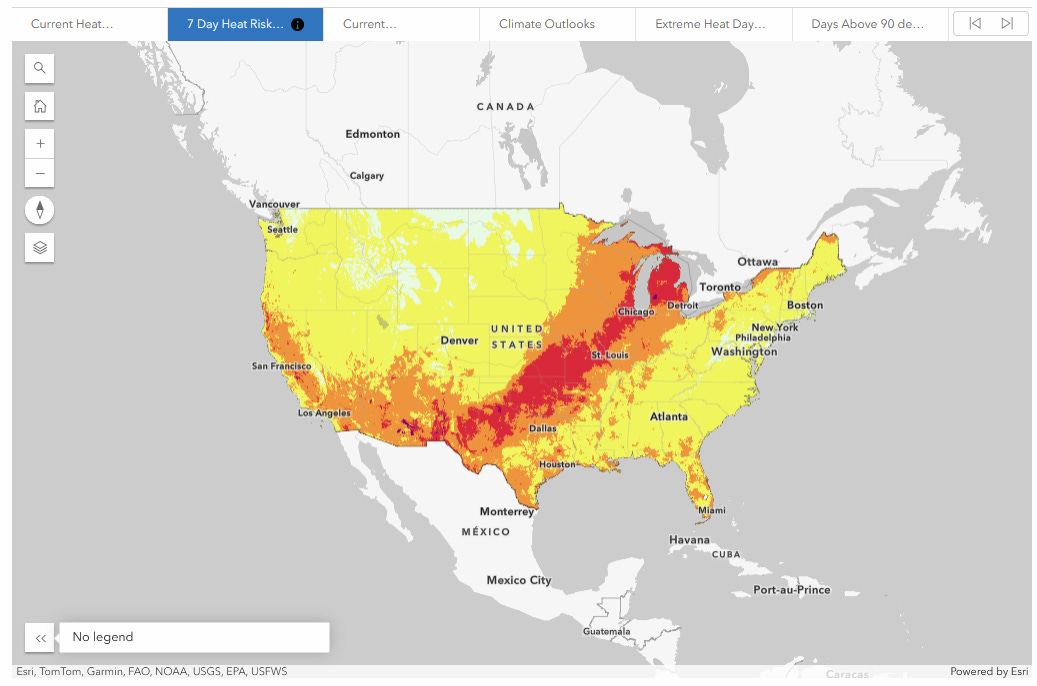
First, we look at the current heat risk. It is high but not as extreme as it has been recently. The pattern in part will move east slowly. Where the Monsoon failed, it will remain hot unless the Monsoon reappears, which is possible but with limited impact on the overall heat situation.
NOAA is committed to their Atlantic Hurricane Forecast, but they do not have money on the table. Maybe September.
From the destructive Dragon Bravo Fire in the Grand Canyon to smokey skies in the Northeast due to Canadian wildfires, discover how drought and fire are impacting the U.S. this summer.
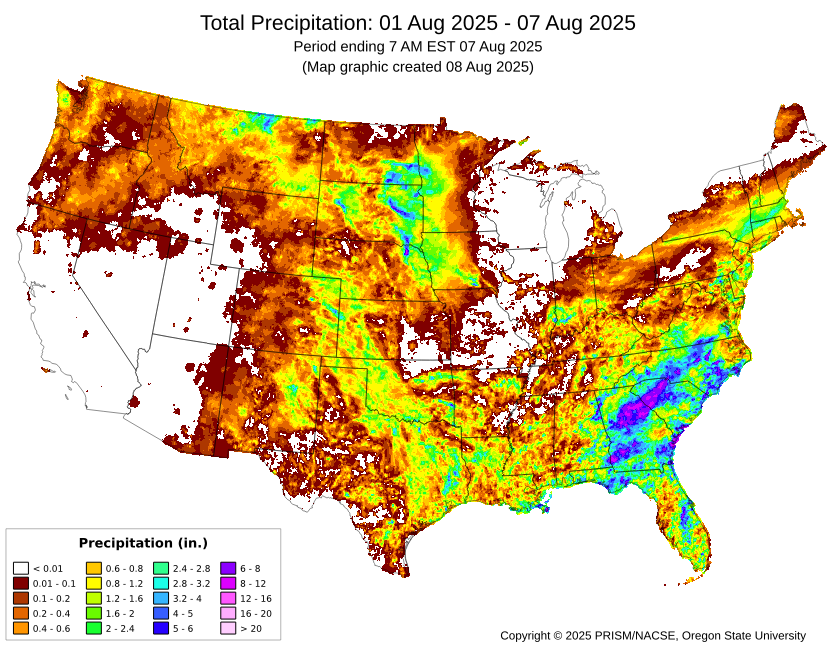
Drought and wildfire interact in numerous ways. Many of the conditions that cause worsening drought can increase wildfire potential. Temperature, soil moisture, humidity, wind speed, and fuel availability (vegetation) are all factors that interact to influence the frequency of large wildfires. When fire sparks in an area that is in drought, drought can affect the intensity and severity of the fire. For example, rapidly drying abundant fuels in forest understories and grasslands after a wet spring can feed larger fires.
This summer, hot and dry conditions are driving large wildfires in the Western U.S. Check out the 11 maps below to better understand the conditions underlying current large fires and what’s forecast for fire and drought in the coming months.
Current Conditions
Large Fires Burning in the West
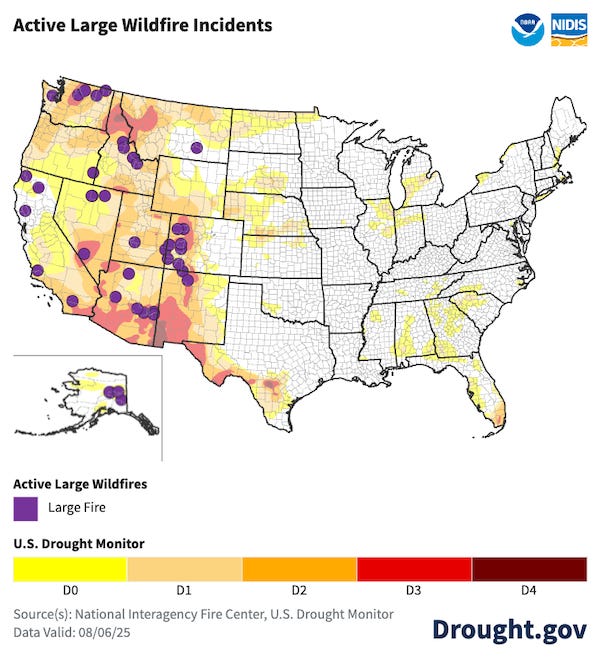
Large wildfires are burning in the Western U.S. Many of these areas are also in drought, according to the U.S. Drought Monitor. The largest uncontained or partially contained fires are currently the Dragon Bravo Fire (130,520 acres) burning in Grand Canyon National Park in Arizona, the Gifford Fire (83,933 acres) in Southern California, and the Bear Creek Fire Group (73,197 acres) in east-central Alaska, according to InciWeb.
This map shows active large wildfires from the National Interagency Fire Center (NIFC) Incident Management Situation Reports, alongside current drought conditions from the U.S. Drought Monitor. This map only includes ongoing "large" wildland fires. It does not include prescribed burns, smaller fires, or other fires not included in NIFC's situation reports. View the latest situation report for more information. Data Sources: National Interagency Fire Center, U.S. Drought Monitor. Map from Drought.gov.
Dry Conditions in the Southwest, Southeast, and Northeast
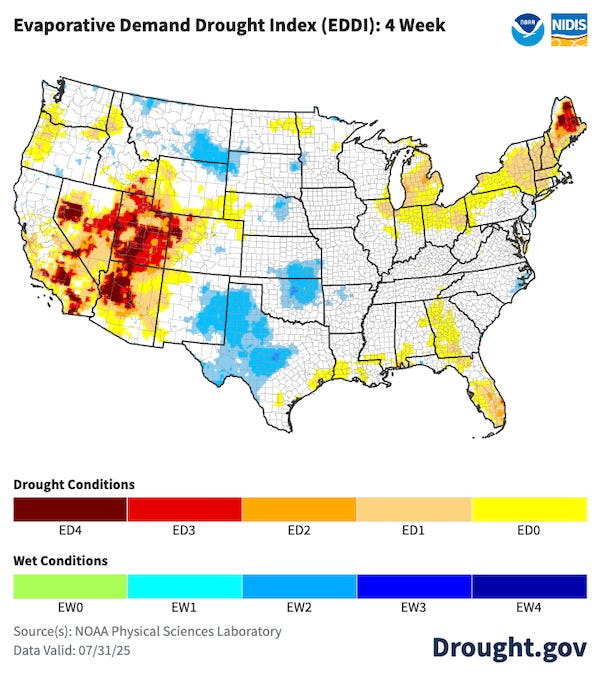
is a measure of the potential loss of water from the land surface due to atmospheric factors. Periods of high evaporative demand are connected to droughts and increased fire danger. Over the last month, the Evaporative Demand Drought Index (EDDI), showed evaporative demand was high in the Southwest, western Oregon and Washington, South Florida, and the Northeast.
Above-normal temperatures, clear skies, high wind speeds, and low humidity increase evaporative demand, which leads to quicker drying at the surface. Reduced soil moisture leaves less water available for plants. When extended periods of low precipitation overlap with extended periods of high evaporative demand, vegetation can become critically dry and support rapidly spreading wildfires.
The Evaporative Demand Drought Index (EDDI) is a drought monitoring tool that shows the anomaly in daily evaporative demand over a given period of time—in this case, the past 4 weeks. Evaporative demand is the atmospheric influence on the drying of the landscape, or "the thirst of the atmosphere." Unusually high evaporative demand can lead to moisture stress on the land surface, and ultimately to drought—even when precipitation has been near-normal. EDDI can offer early warning of agricultural drought, hydrologic drought, and fire-weather risk. Map: drought.gov Data Source: NOAA Physical Sciences Laboratory
Smoke Reducing Air Quality Across the U.S.
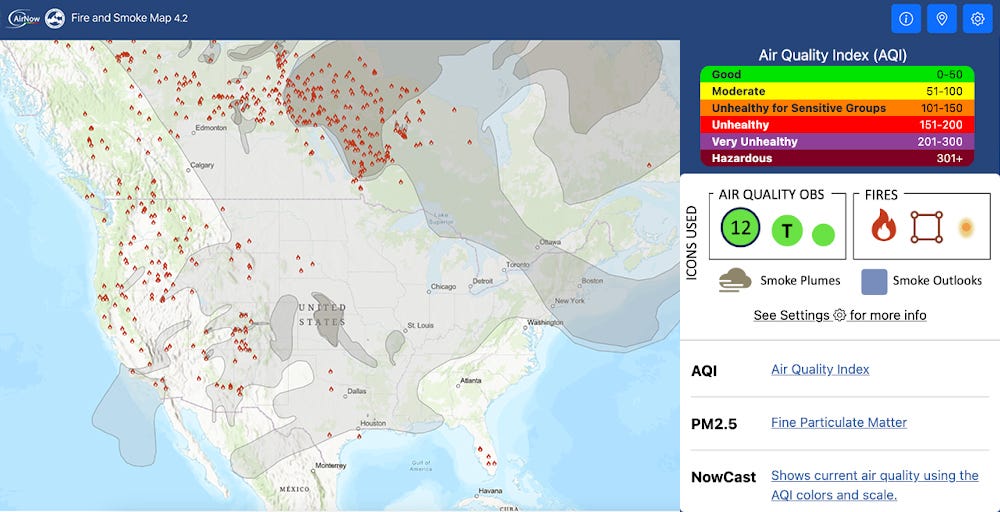
Wildfire smoke can negatively impact air quality and harm human health. A number of large wildfires are burning
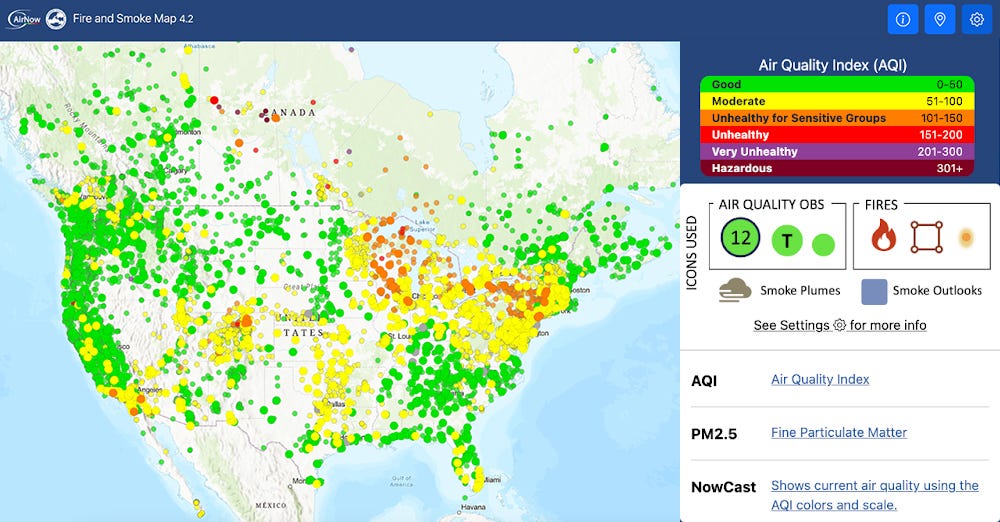
in the Canadian provinces of Manitoba and Saskatchewan. Much of the U.S. is currently exposed to wildfire smoke, as smoke from these and wildfires in Colorado and California is drifting across the Nation. Air quality is particularly poor in the Upper Midwest, Northeast, northern Colorado, and southern California.
The U.S. Air Quality Index (AQI) is designed to communicate whether air quality is healthy or unhealthy. When air quality reaches unhealthy levels in your area, the Centers for Disease Control and Prevention recommend keeping outdoor activities light and short and heading indoors to cleaner air if you experience symptoms. Groups sensitive to air pollution should avoid the outdoors all together.
This map shows observed air quality conditions based on fine scale particulate (PM2.5) concentrations. Green dots indicate healthy air quality, while yellow, orange, and red dots indicate progressively hazardous air quality conditions. Map: AirNow Fire and Smoke Map.
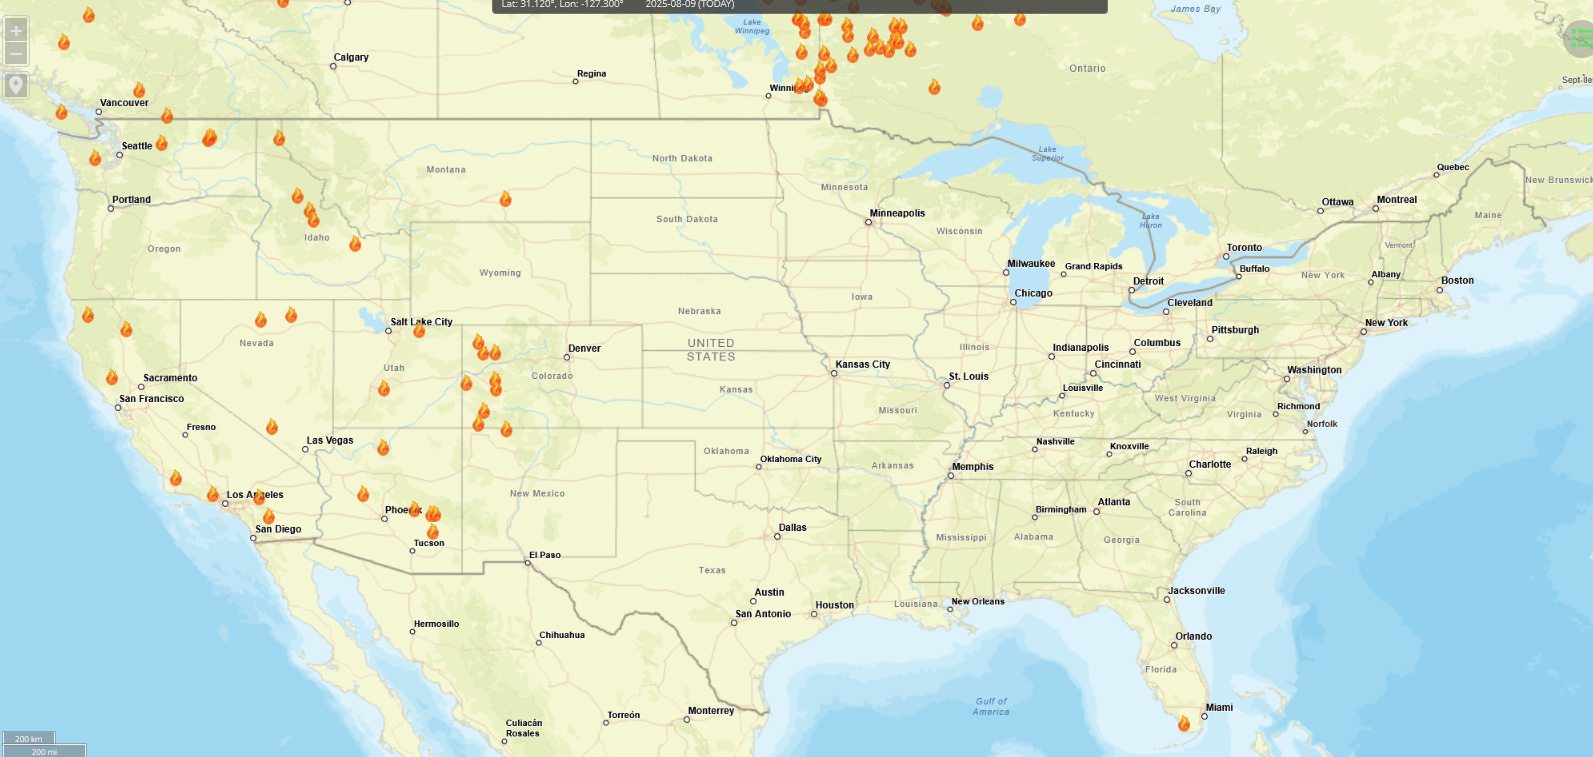
This map shows fire locations from incidents and satellite detections and smoke plumes detected by satellites. Grey shading indicates smoke plumes. Fire locations are represented as blaze icons. Map: AirNow Fire and Smoke Map.
Elevated Risk of Post-Fire Debris Flows in Parts of the West
Fires create danger after the burn, too. After a wildfire, communities and watersheds may face dangerous debris flows. Post-fire debris flows can occur in the years immediately after wildfires in response to high-intensity rainfall events. These debris flows are a danger to human life. They can occur with little warning and can carry enough force to damage structures, strip vegetation, and block drainage ways. Fires also alter watersheds and can reduce available water supplies for communities due to water quality problems in burned areas.
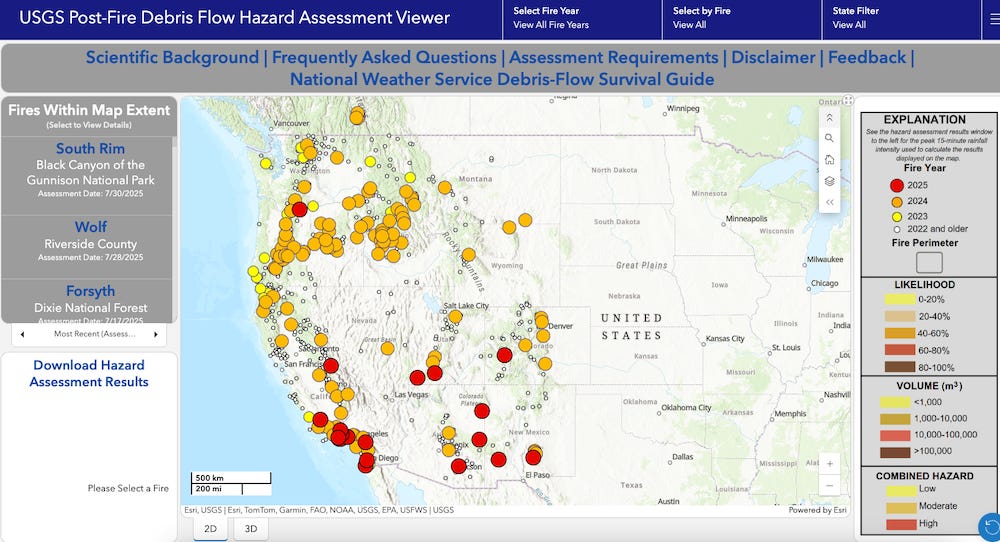
allows users to view or download post-fire debris flow hazard assessment data. The points on the map show the burn area locations where the USGS conducted hazard assessments from 2023-2025.
The map above depicts areas that have been assessed for post-fire debris flows in the last three years. Click the image to view an interactive map that can display the likelihood and potential volume of debris flows as they exit the mountain front in response to a storm with a 15-minute peak rainfall intensity of 24 mm/hour. The models are designed to assess the potential for debris flow in the locations where debris flows form and get larger. Map: U.S. Geological Survey Post-Fire Debris Flow Hazard Assessment Viewer.
Dry Vegetation in the West, Southeast
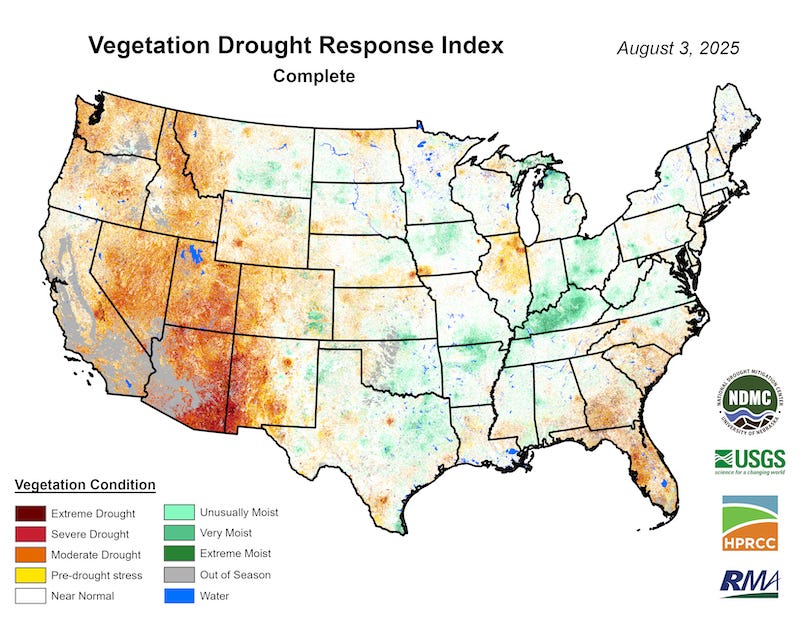
Dry vegetation is one factor that influences how large and damaging a wildfire becomes. Currently, the Vegetation Drought Response Index, VegDRI, indicates there is dry plant matter across the Western U.S., in the Southeast, and in northern Illinois. This area of dryness in Arizona underlies the Dragon Bravo Fire burning in Grand Canyon National Park and surrounding areas.
The Vegetation Drought Response Index, VegDRI, depicts vegetation stress in the contiguous United States based on climate related variables and vegetation conditions measured by normalized difference vegetation index (NDVI). Orange and red hues indicate vegetation stress.
Looking Ahead
Fire Weather Tomorrow in Parts of the West
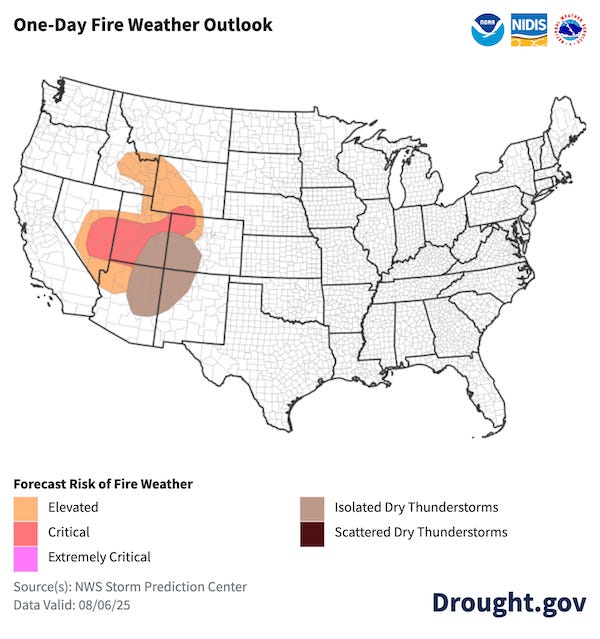
Critical fire weather conditions are forecast in parts of Wyoming, Colorado, Utah, and Nevada tomorrow. Elevated risk is predicted west of the Rocky Mountains from southern Montana to Arizona. Isolated dry thunderstorms are predicted in the Four Corners region.
The National Weather Service's Storm Prediction Center produces daily fire weather outlooks, which delineate areas of the continental U.S. where pre-existing fuel conditions, combined with forecast weather conditions, will result in a significant threat for the ignition and/or spread of wildfires.
Extreme Heat Expected This Week in the Southern Half of the U.S.
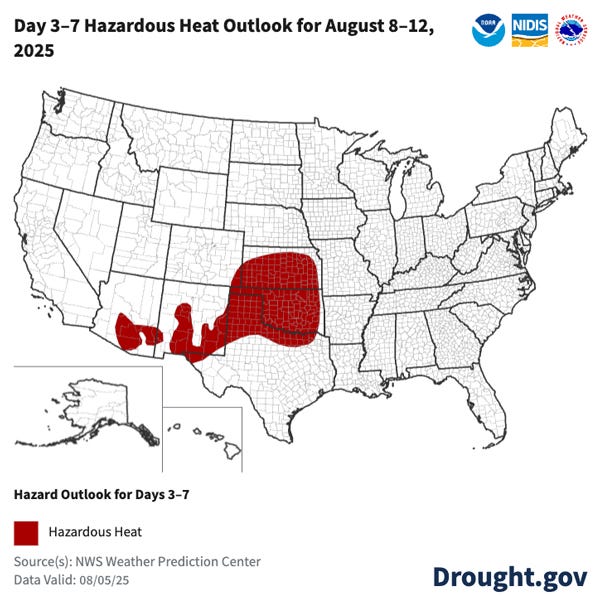
Temperature is one of the key factors in determining how wildland fires start and spread. Temperature affects the flammability of forest fuels, since the amount of heat required to raise the temperature of the fuels to the ignition point depends on their initial temperature and that of the surrounding air. Temperatures can also influence the way fires spread and how quickly fuels combust. Hazardous heat is predicted later this week in the Southern Plains and portions of New Mexico and Arizona.
This National Weather Service Day 3–7 Hazard Outlook map shows the risk of hazardous heat 3 to 7 days from now. A hazardous heat risk area typically indicates a 40% or greater chance of exceeding National Weather Service Heat Advisory criteria, based on the Heat Index for your location, or widespread major (level 3) or scattered extreme (level 4) HeatRisk.
This National Weather Service Day 3–7 Hazard Outlook map shows the risk of hazardous heat (red) 3 to 7 days from now (August 8–12, 2025). Map: drought.gov. Data: NWS Weather Prediction Center.
Potential for Large Fires Continues in the West and Hawaii
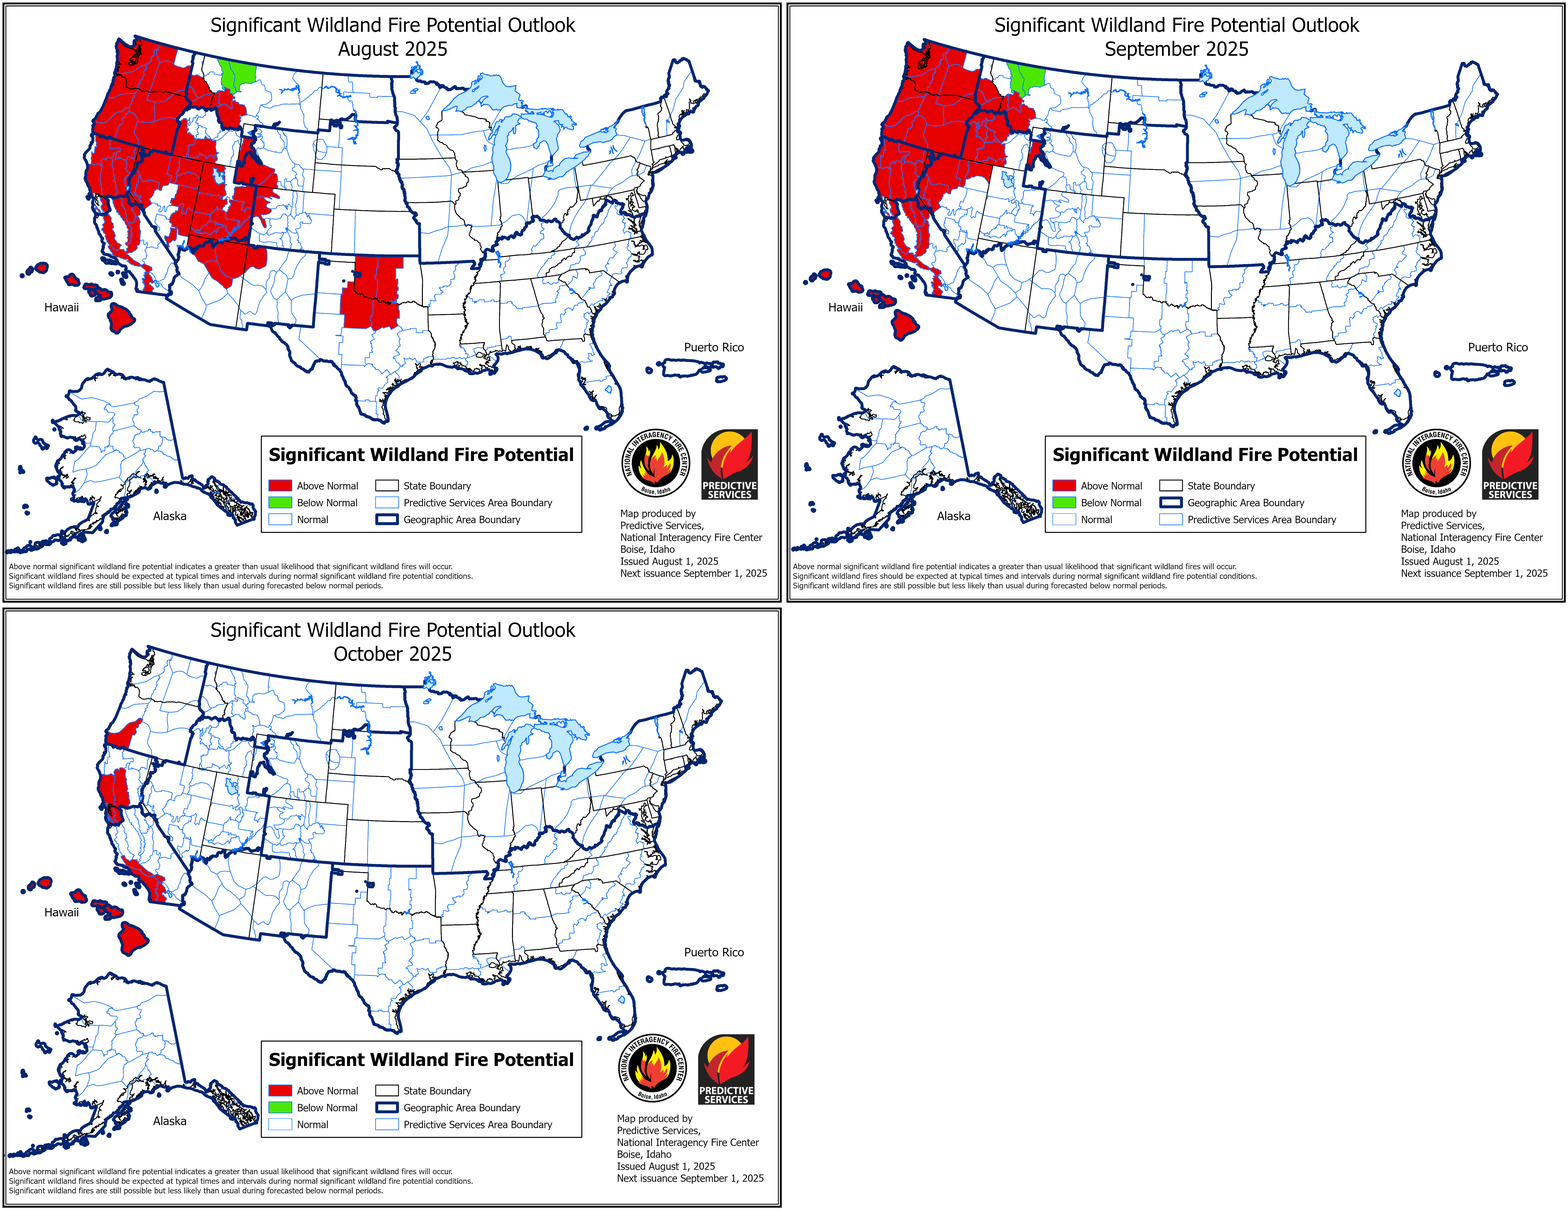
Above-normal risk of significant wildland fires is forecast in Hawaii and much of the West, as well as a portion of the Southern Plains this month, according to the National Interagency Fire Center (NIFC). In September, this risk is reduced to Hawaii and areas west of the Rocky Mountains.
Above-normal significant wildland fire potential indicates a greater than usual likelihood of significant fires, which are fires that require mobilization of resources from outside the fire event area.
Seasonal Outlooks Favor Warm Conditions Across The Nation
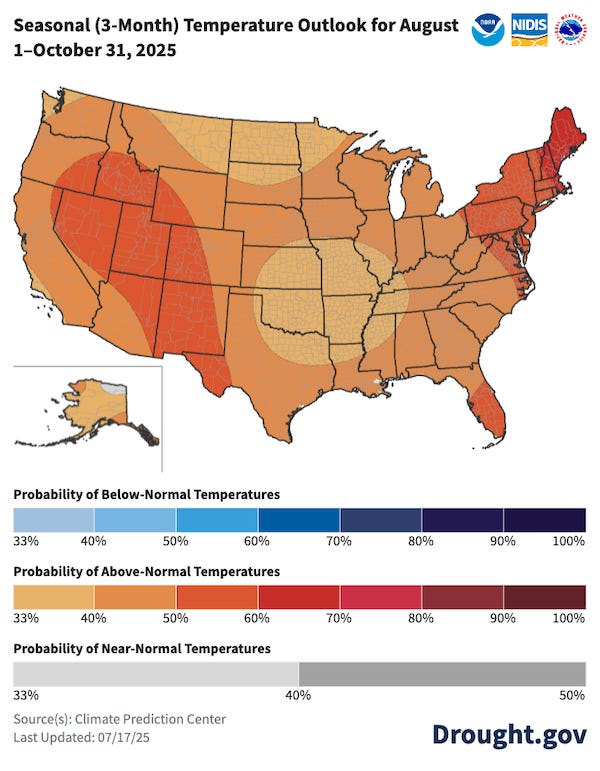
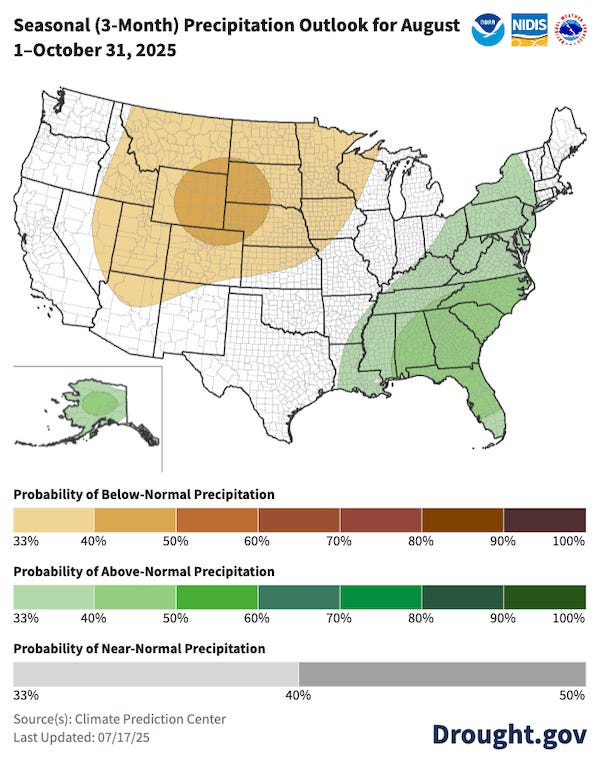
Seasonal outlooks favor conditions conducive for wildfire in much of the Western U.S. The Lower 48 and Alaska are favored to see above-normal temperatures over the next three months. Portions of the West and North Central U.S. lean dry over the next three months.
This map shows the probability (percent chance) of above-normal (red hues), near-normal (gray hues), or below-normal (blue hues) temperatures over the next three months. White areas indicate equal chances of above-, near-, or below-normal temperatures. Map: drought.gov. Data Source: NOAA NWS Climate Prediction Center.
This map shows the probability (percent chance) of above-normal (green hues), near-normal (gray hues), or below-normal (brown hues) precipitation over the next three months. White areas indicate equal chances of above-, near-, or below-normal precipitation.Map: drought.gov. Data Source: NOAA NWS Climate Prediction Center.
NOAA is also hosting a webinar series, “NOAA Fire Research: from Conditions to Impacts,” which showcases fire research activities and their impact on science and services to safeguard American lives and property. View upcoming webinars and recordings of past events.
Keep Up With the Latest Conditions and Outlooks
Find maps, publicly accessible data, and recent research about drought and wildfire on drought.gov. You can also subscribe to NIDIS emails for the latest regional drought updates, webinars, and news in our drought early warning system regions. To stay up to date on the latest drought conditions, sign up to receive drought alerts for your city/zip code when the National Weather Service updates their U.S. Drought Outlooks.
Evaporation
In 1993, W.Jim Shuttleworth modified and adapted the Penman equation to use SI, which made calculating evaporation simpler.[2] The resultant equation is:
E m a s s = m R n + γ ∗ 6.43 ( 1 + 0.536 ∗ U 2 ) δ e λ v ( m + γ )
where:
Emass = Evaporation rate (mm day−1)
m = Slope of the saturation vapor pressure curve (kPa K−1)
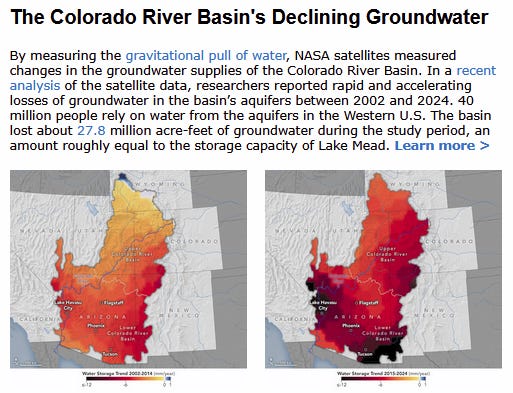
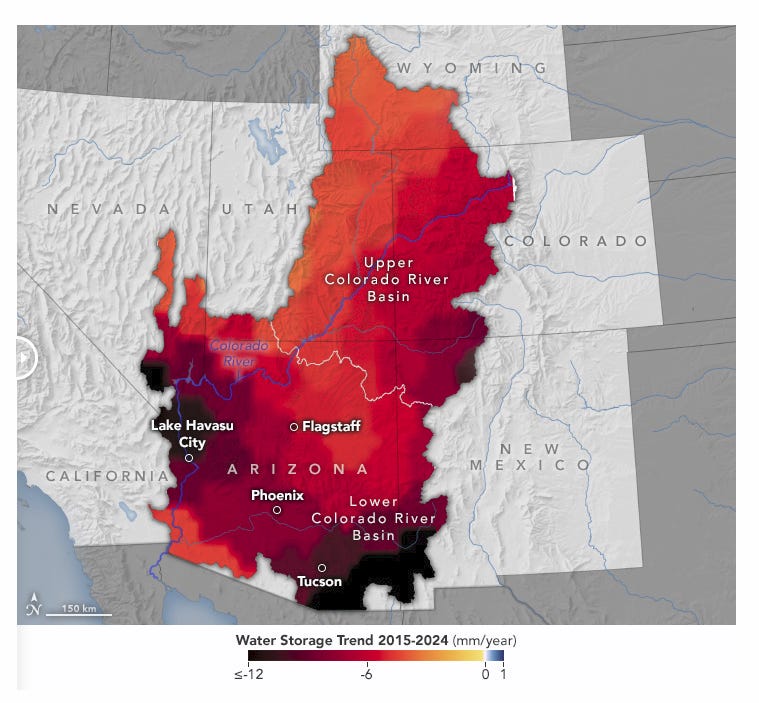
First of all, the measurement technology is interesting. Hcre is the LINK to the full NASA article. Some other states might want to use this technology. It is perhaps difficult to determine the accuracy of the method.